20. Monitoring Rules
Each rule executed by the DCM—in this instance, mostly custom rules—is passed to an underlying AppBase service and queued to be executed. The Queue Monitor shows all the rules executed by the DCM, whether the rule was executed successfully, and the date it ran.
When opening the queue monitor page, a list of services and events that have either been successfully or unsuccessfully completed will be presented. It is also possible to inject a job manually by adding the rule's name and any parameters for the system to process it.
If you haven’t received any email in the state Send Email, you can check here the status of the rule's execution.
Steps
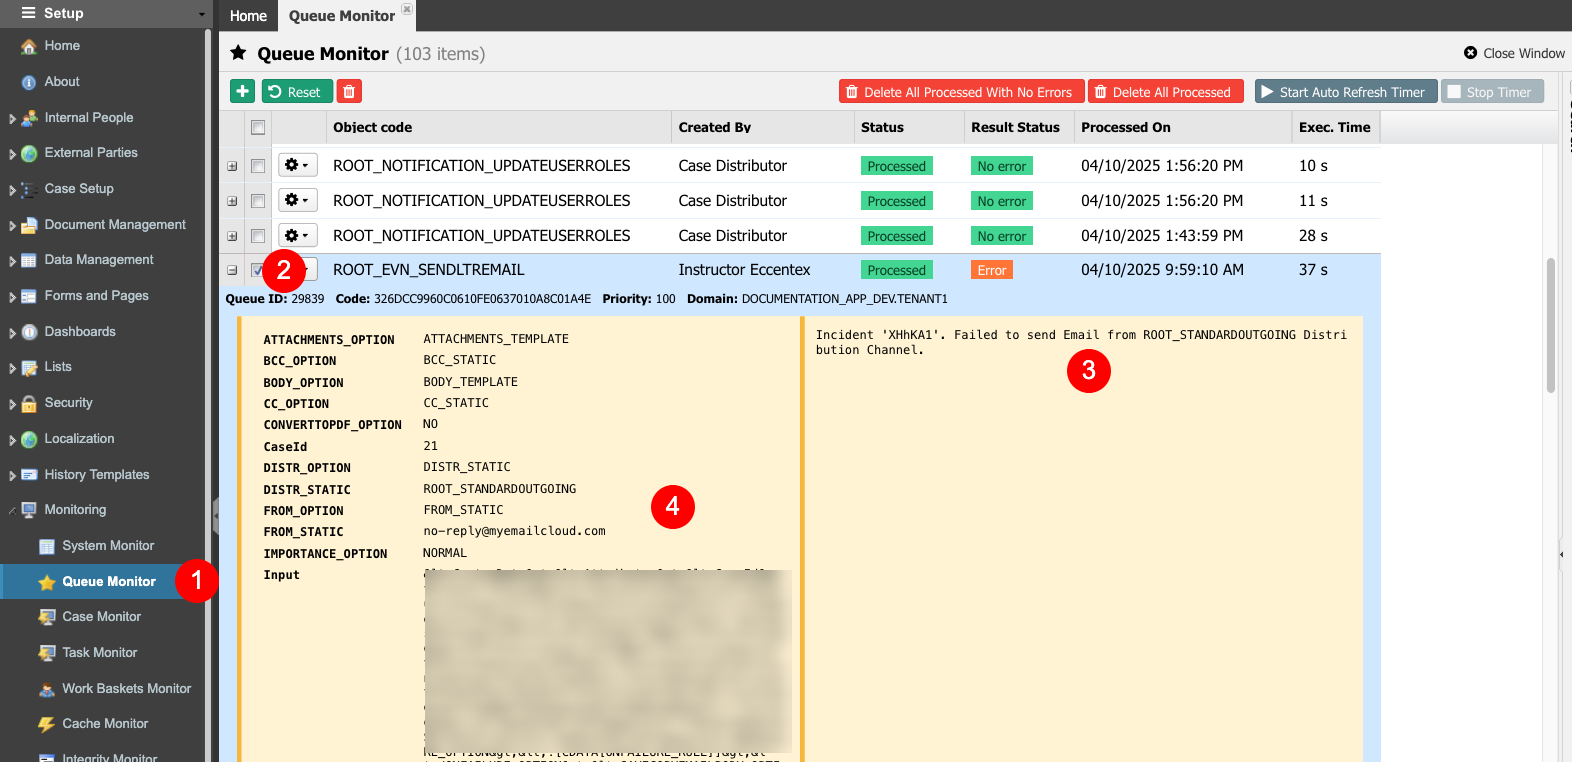
- Navigate to Setup → Monitoring → Queue Monitor (1)
- Expand the row for the rule ROOT_EVN_SENDLTREMAIL by clicking the plus button to the left of the name of the rule (2).
- The right column of the screen is to validate the error code, and if so, check the error message (3).
- The left column shows information about the parameters passed to the rule when launched (4). This detailed information is helpful to assist in the troubleshooting process.

- To execute the refresh of the list automatically, click the Start Auto Refresh Time button. To stop the autorefresh, click the Stop Timer button.
- To clean up the list of all the completed jobs that have no errors shown in the Queue Monitor, click the Delete All Processed With No Error button.
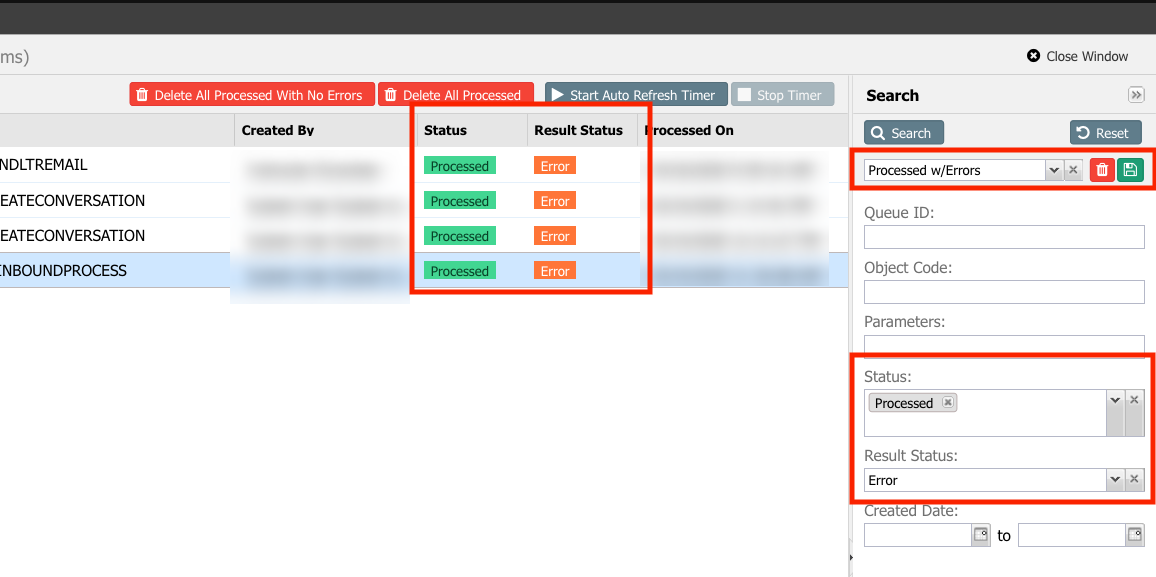
- Expand and use the Search pane on the right side to filter the list. Using the plus button, save the frequent filter options.

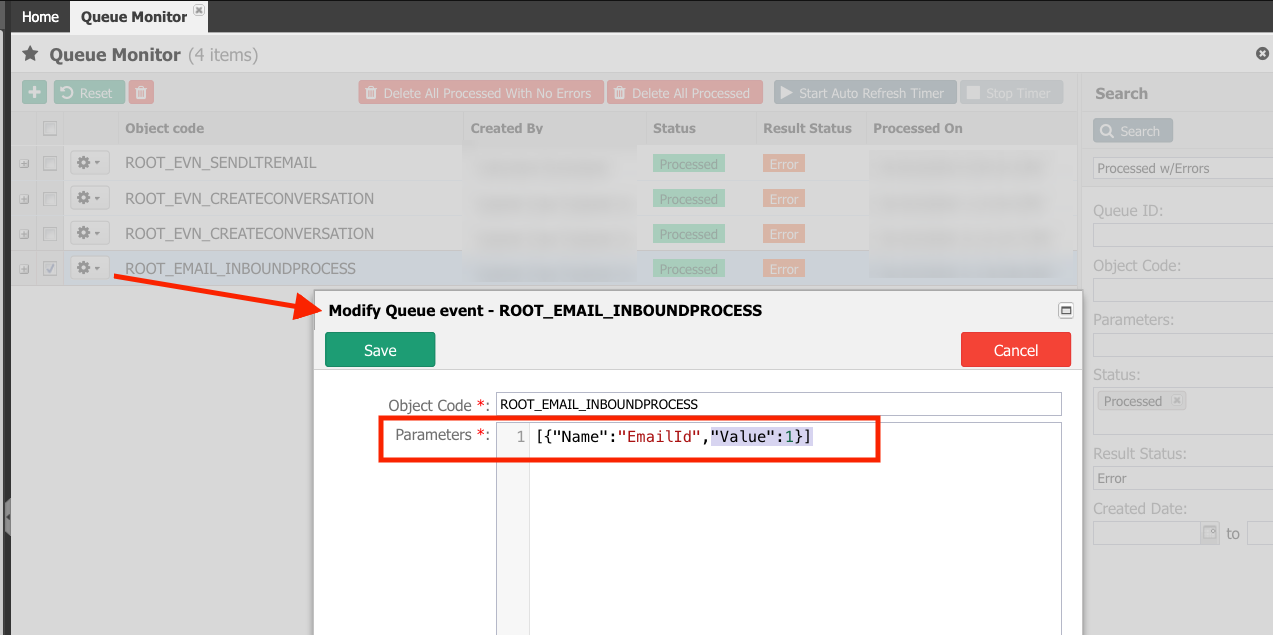
- To re-run a rule with the same or eventually different parameters, click the gear and select the Quick Modify option.

