Overview of the Dashboard Designer
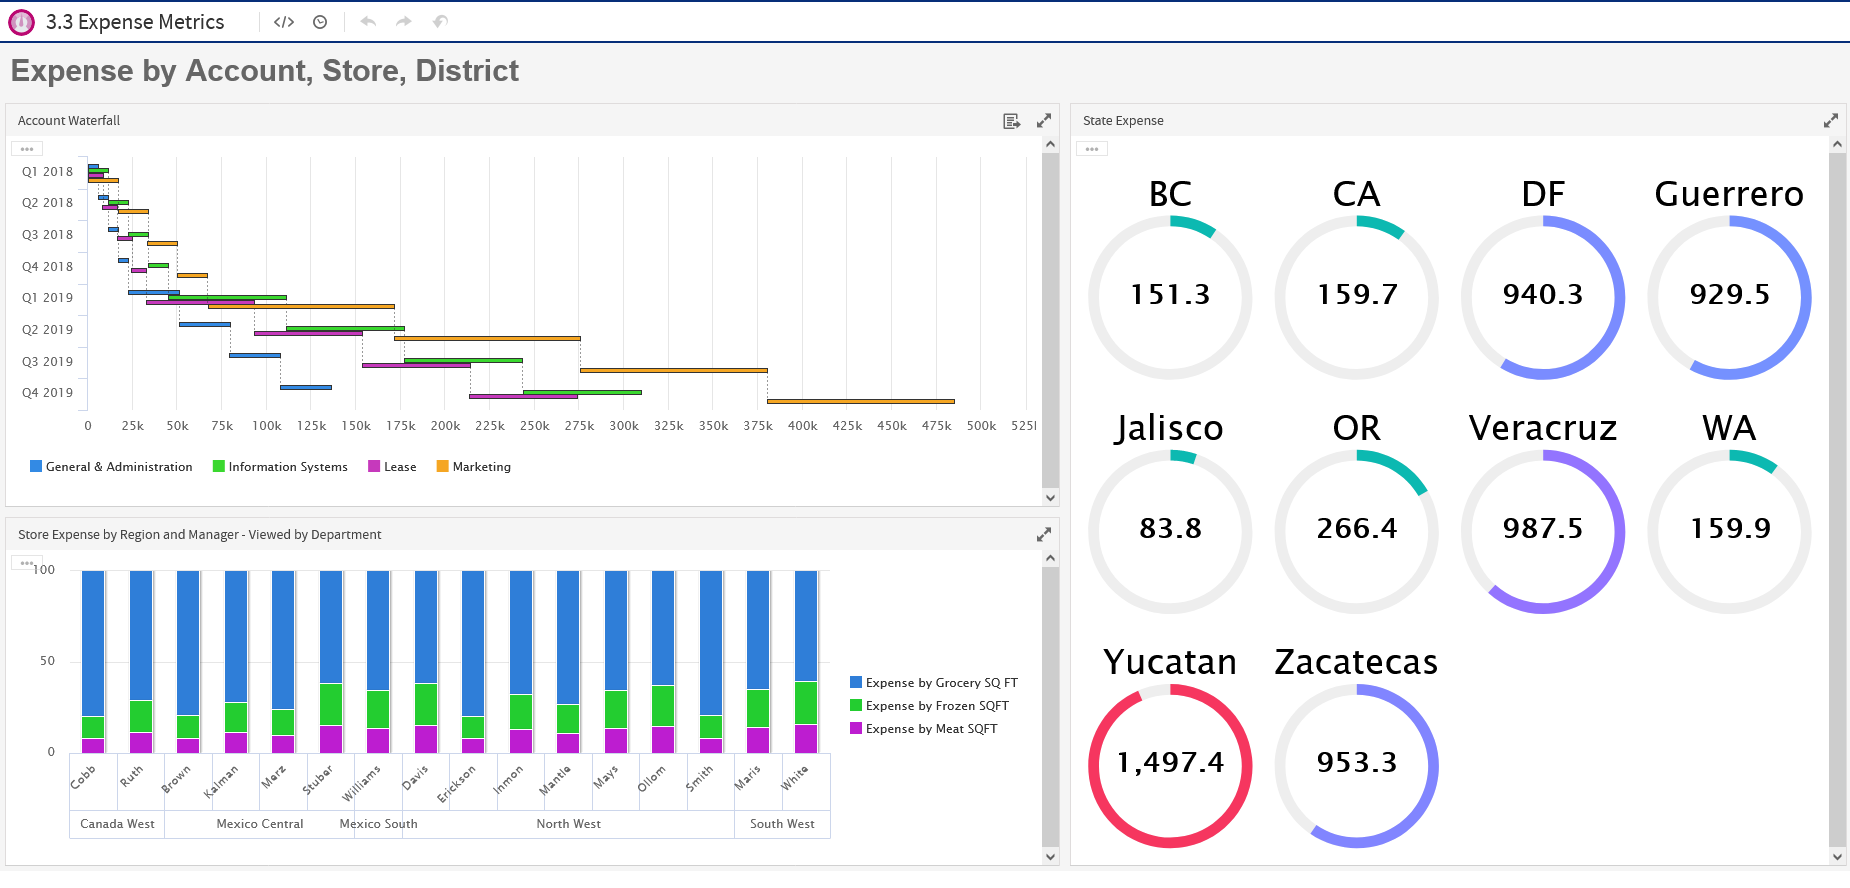
A dashboard displays several reports in a single, integrated view. A dashboard can include input controls for choosing the data displayed in one or more dashlets, and custom dashlets that point to URLs for other content. By combining different types of related content, you can create appealing, data-rich dashboards that quickly convey trends.
The Dashboard Designer is a web-based UI for embedding reports, Ad Hoc views, and other BI objects into a single, interactive space. You can compile dashboards that include pre-existing elements, such as reports and views, and create new charts, tables, and crosstabs from your data sources directly from the designer.
Each element on your dashboard is called a Dashlet. Dashlets have unique names and resource IDs, and editable properties that vary depending on the Dashlet type.
Your permissions to access the repository may limit the content you can add and the location where you can save the dashboard.