
Debugging Rules in AppBase Studio
AppBase developers dedicate a substantial amount of time to crafting and debugging rules. Recognizing the critical role of rule development in application success, AppBase 7.1 R3 introduces a significant overhaul of the rule debugger, designed to elevate user comfort and quality.
This latest iteration boasts a meticulously redesigned user interface optimized for clarity and efficiency. Intuitive navigation and streamlined workflows empower developers to delve deeper into rule logic more easily, fostering a more productive and enjoyable debugging experience.
Furthermore, AppBase 7.1 R3 introduces many functional enhancements to the rule debugger, further augmenting its capabilities. These advancements include:
- Enhanced breakpoints: Developers now benefit from more granular control over rule execution, enabling them to set breakpoints at specific points within a rule, facilitating pinpoint debugging.
- Improved variable inspection: A redesigned variable inspector provides a comprehensive and readily digestible view of rule variables, allowing developers to analyze their values and identify potential issues effortlessly.
- Streamlined logging: Enhanced logging functionality offers developers a more detailed and insightful view of rule execution, providing valuable context and facilitating the identification of subtle bugs.
- Expanded documentation: Comprehensive documentation provides developers with readily available resources to explore the full potential of the revamped rule debugger, maximizing its efficiency and effectiveness.
Steps
This procedure explains how to debug a business rule manually.
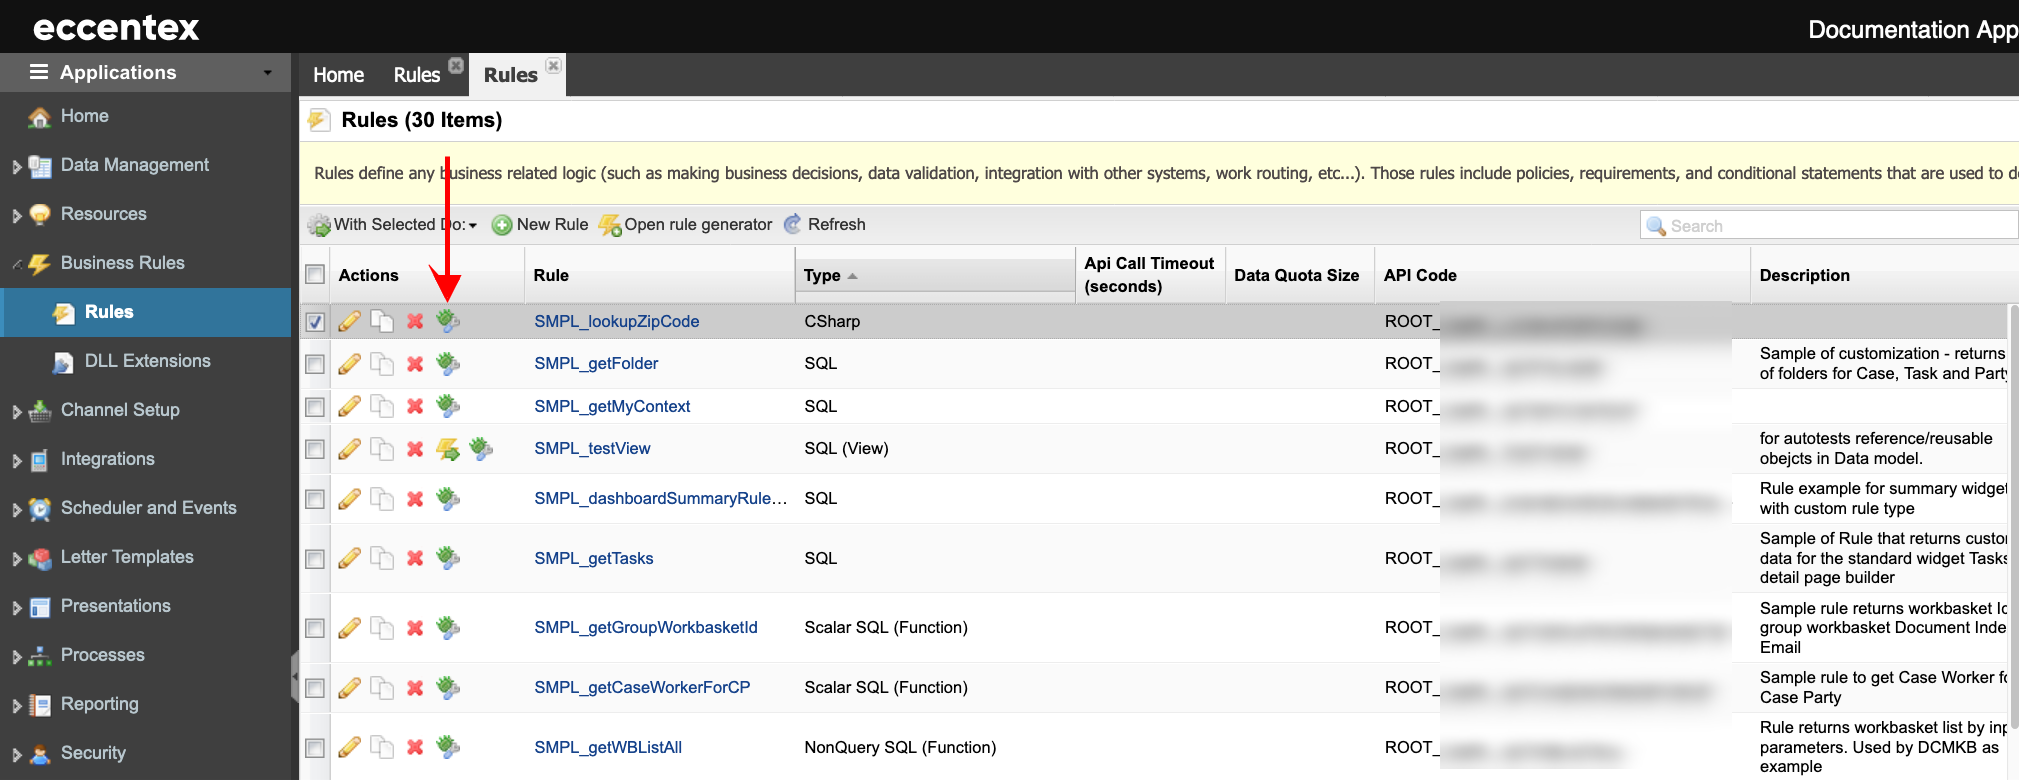
- Navigate to Business Rules → Rules to open the rules window.
- Click the Debug button next to the name of the rule. The debugger will open in a separate tab.
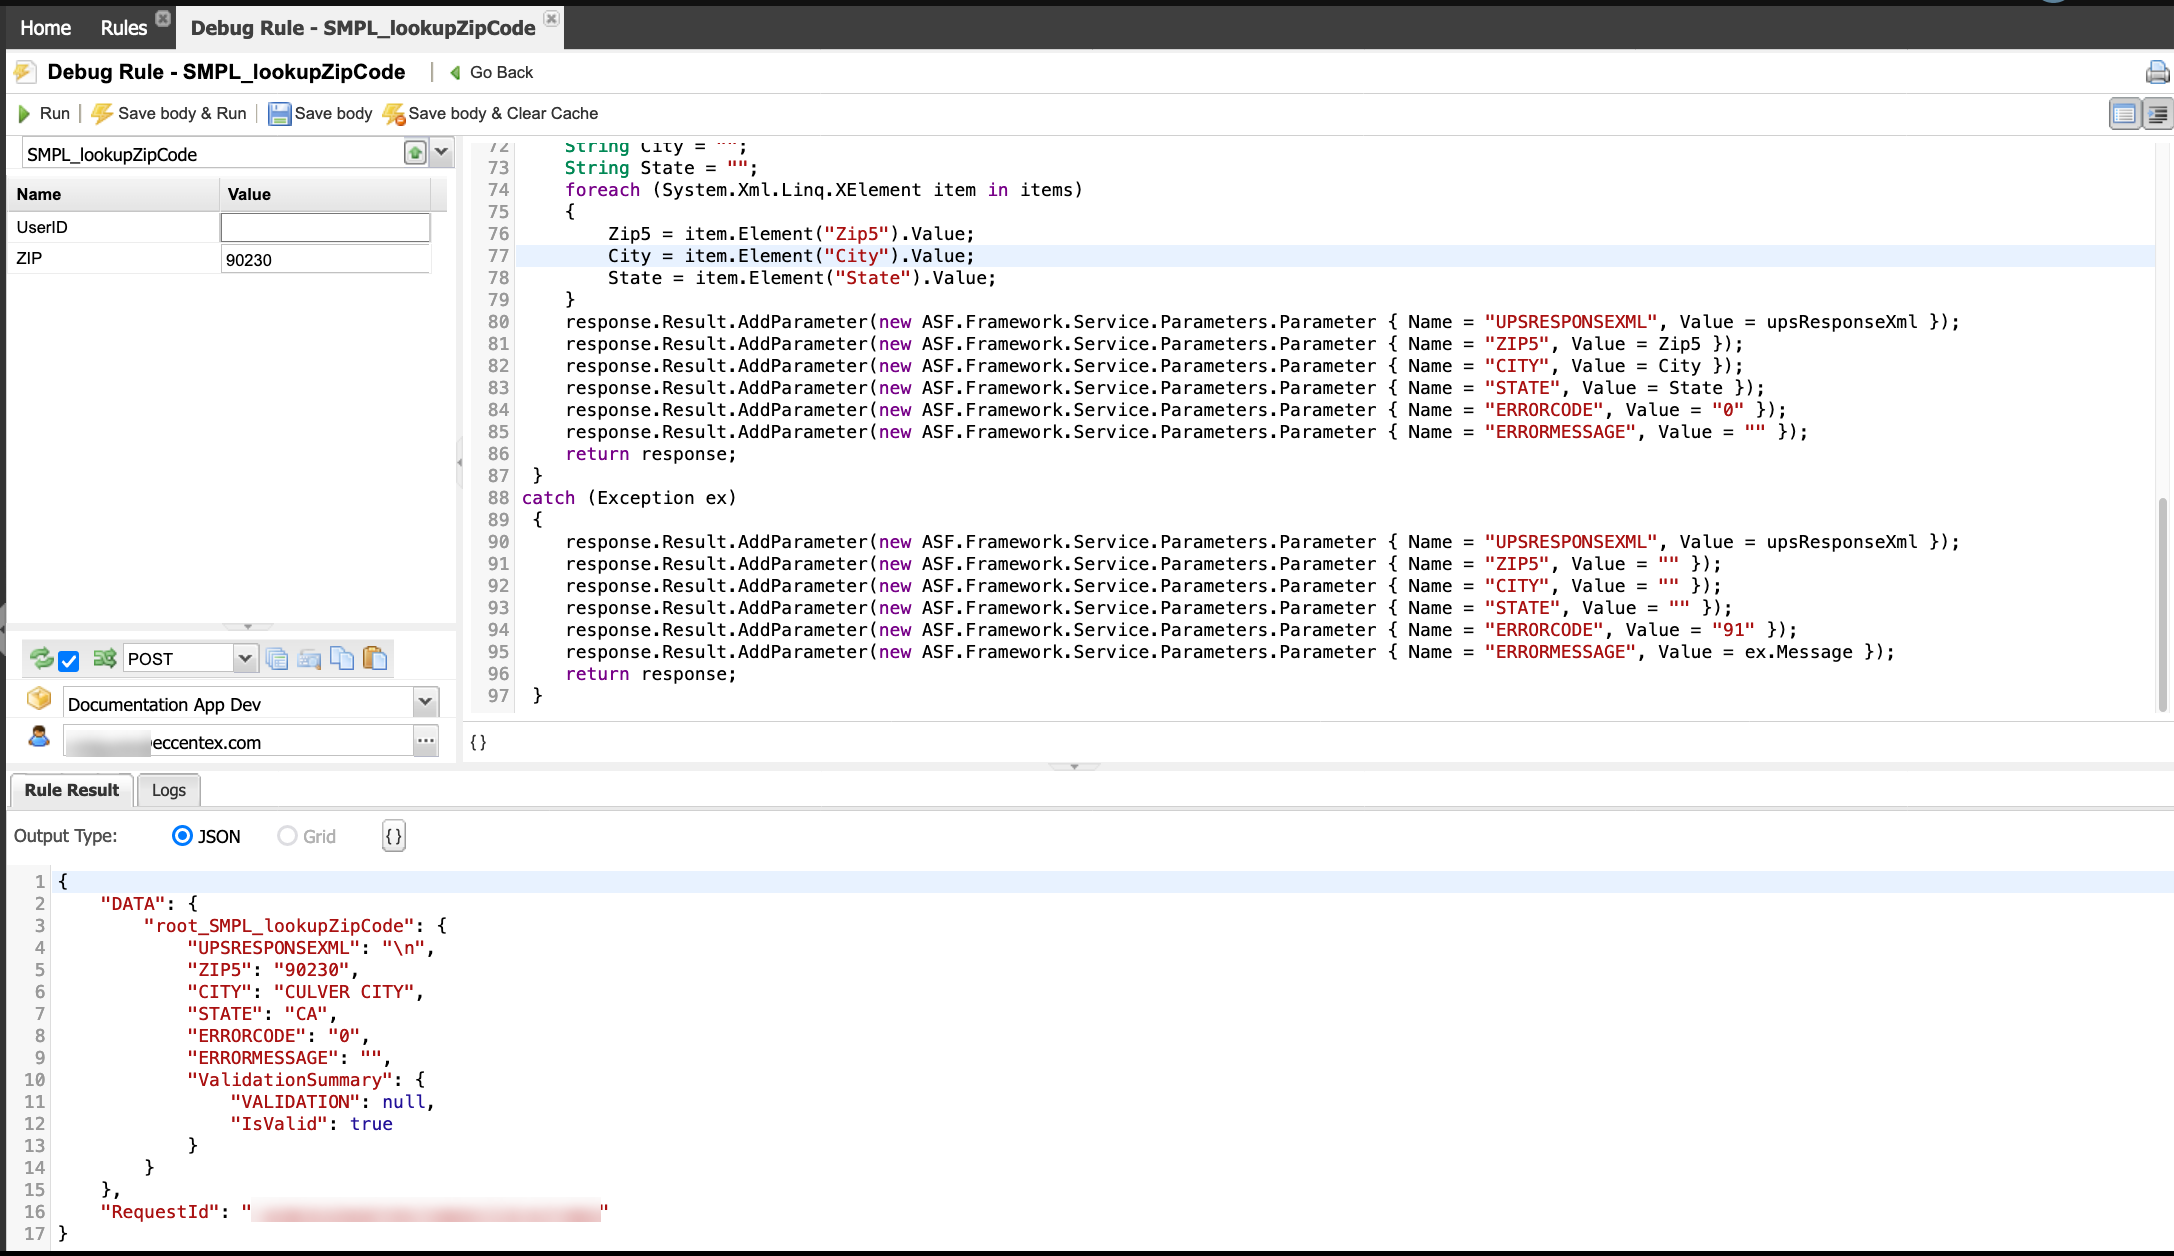
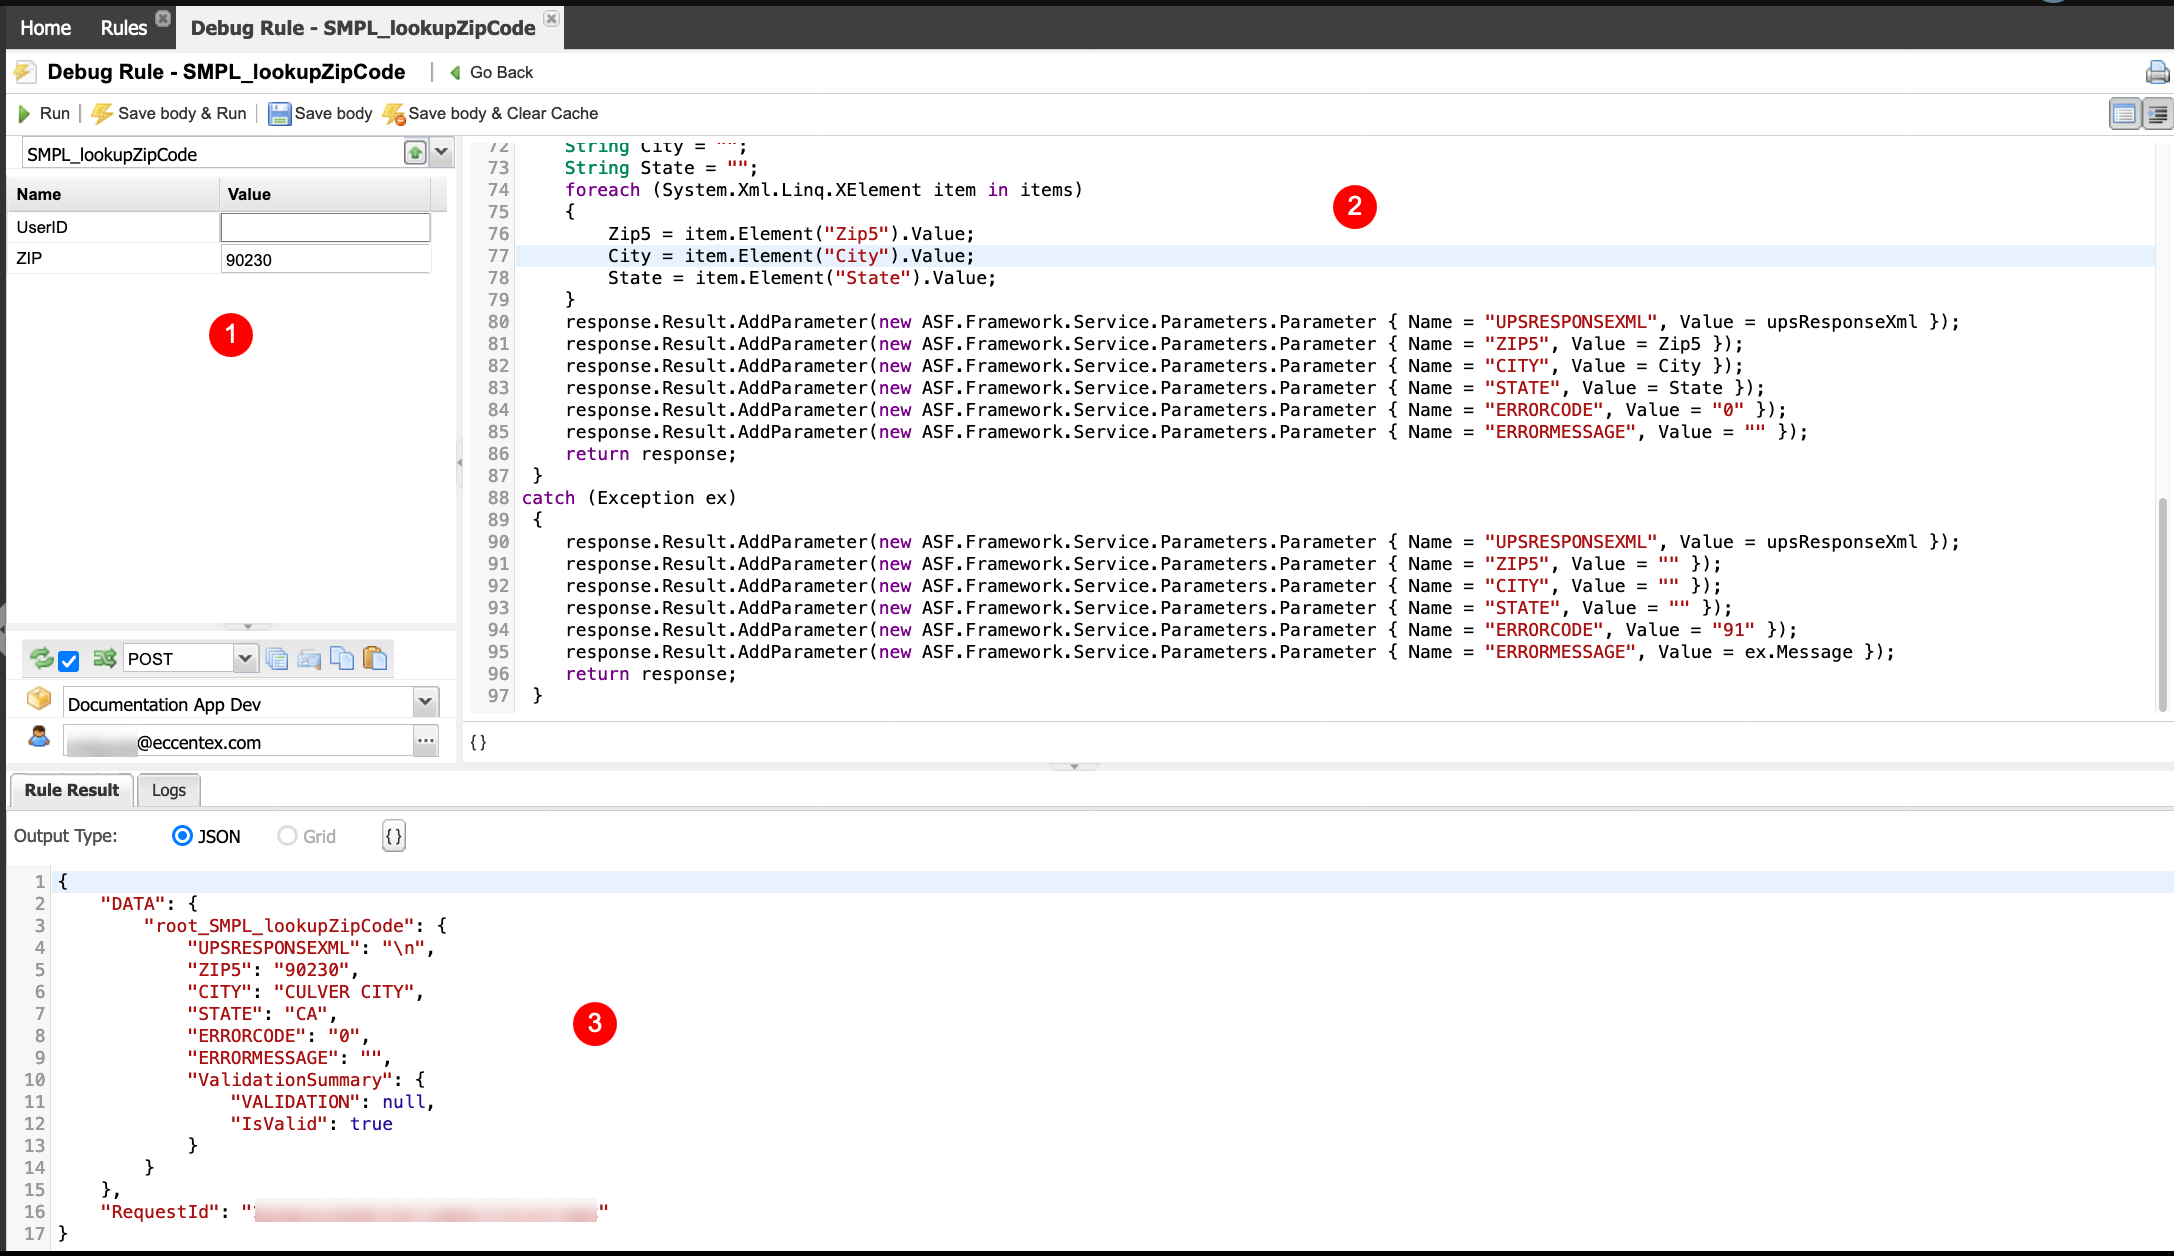
- The debugger is divided into three areas:
- Rule parameters
- Rule code
- Rule results
- Provide the parameters needed to execute the rule and click the Run button.
- The result will be shown in the bottom pane, Rule Result.
- You can make modifications to the code (body) and click the Save body button to update the rule.
- In some scenarios, you must clear the cache before running the rule for testing by clicking the Save body & Clear Cache button.
- Click the Go Back button when done to close the debug tab.
There can be only one instance of the rule debugger for each rule. If you try to reopen a debugger rule, the previously opened debugger becomes active.
New Functionalities
Save body & Run button: The rule’s body is saved, and then the rule is executed automatically.
Rule code formatting: Format the rule code (automatic indent). Click the brackets icon ({}) at the bottom.
Rule result formatting: Manually format the rule results in JSON. Click the brackets icon ({}) at the bottom.
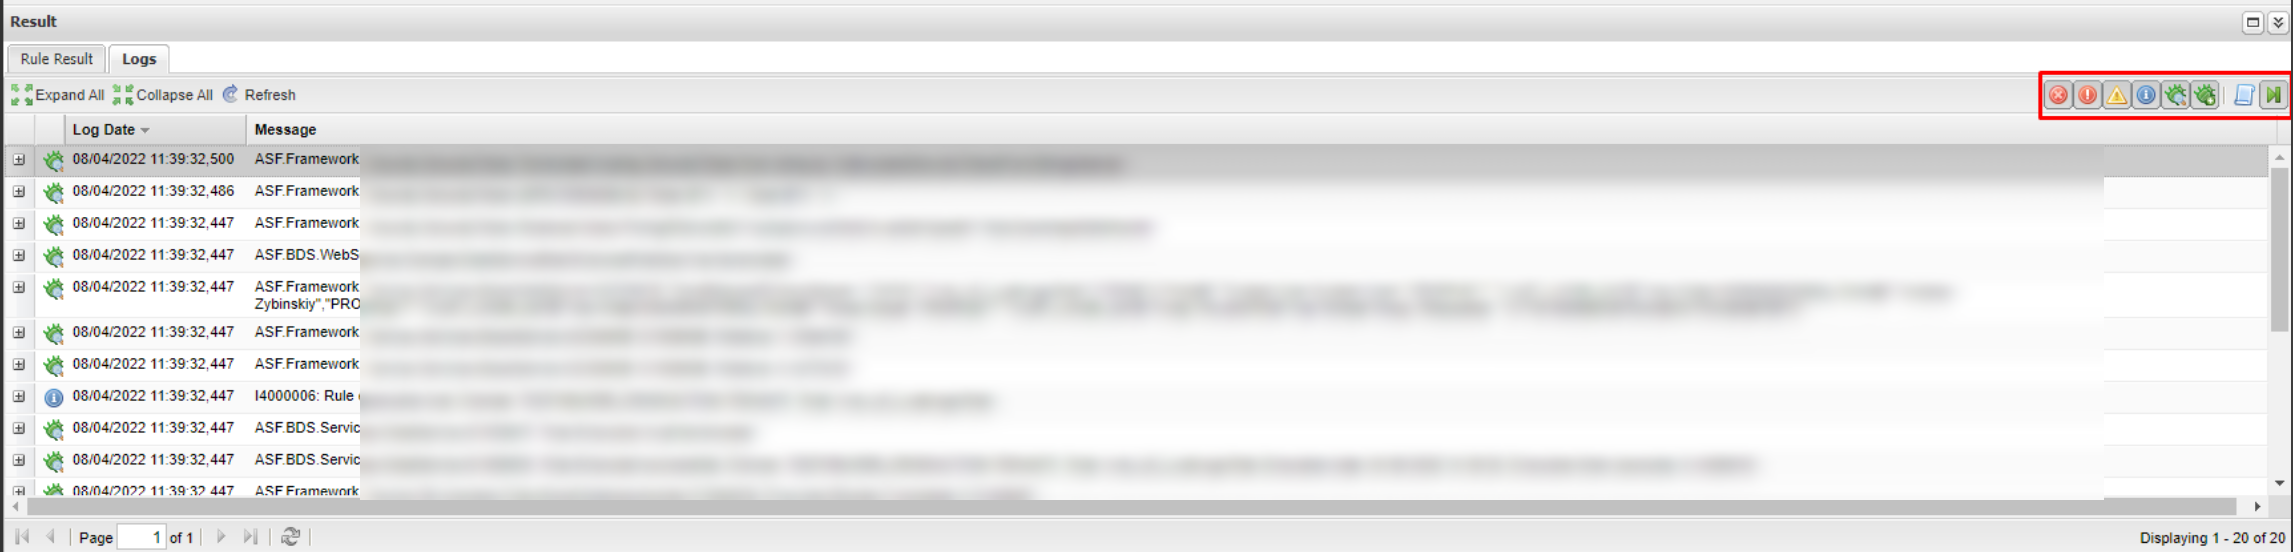
Rule execution logs: If the AppBase is configured and enabled to save logs to the ELK stack, the rule debugger shows the logs of the rule's execution.
IMPORTANT Meaning that the logs are indexed with a delay.
Log filtering: The following switches are used to filter logs.
Switch | Description |
|---|---|
| Show Critical logs |
| Show Error logs |
| Show Warning logs |
| Show Information logs |
| Show Debug logs |
| Show Trace logs |
| Show log records with normalized rule body only. All other filtering parameters will be ignored |
| Show the log of the current run only |


