With the basis of your new report now created, you can use the report designer to start laying your report.
There are also some important settings that need to be applied in order for the report to work when uploaded to AppBase.
Steps
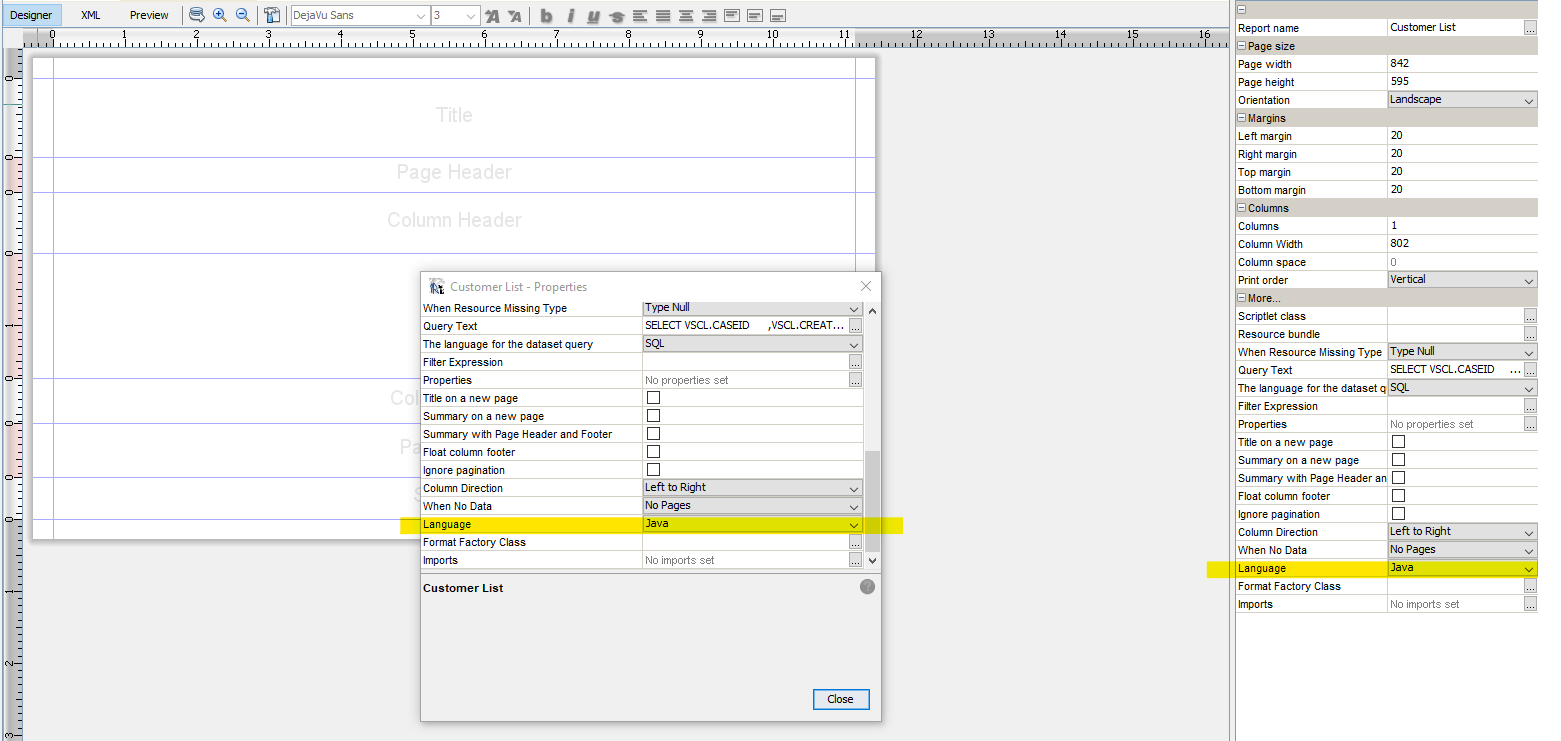
The first, mandatory, setting is to configure the language of the report. In the report designer, right-click on the report and select Properties, or in the Properties pane at the right
Look for the Language property and change it from Groovy (default) to Java.
An incorrect language can cause the report to fail when uploading to AppBase, it is recommended you change it to Java.
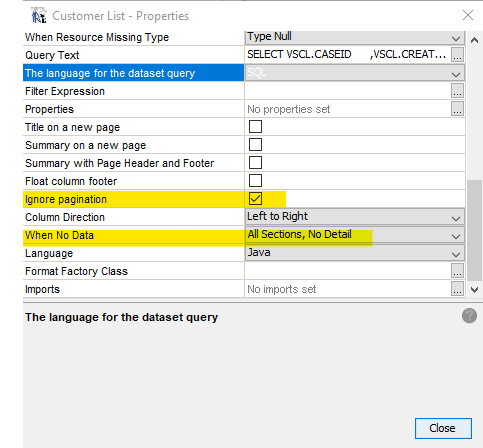
Change the When No Data setting to All Section, No Details so that anybody running the report that returns no results will still see a basic outline of the report to confirm it ran correctly.
It is recommended set IgnorePaginationUNLESS all reports are to be run in PDF and the preference is to have multiple pages rather than one long page of results.
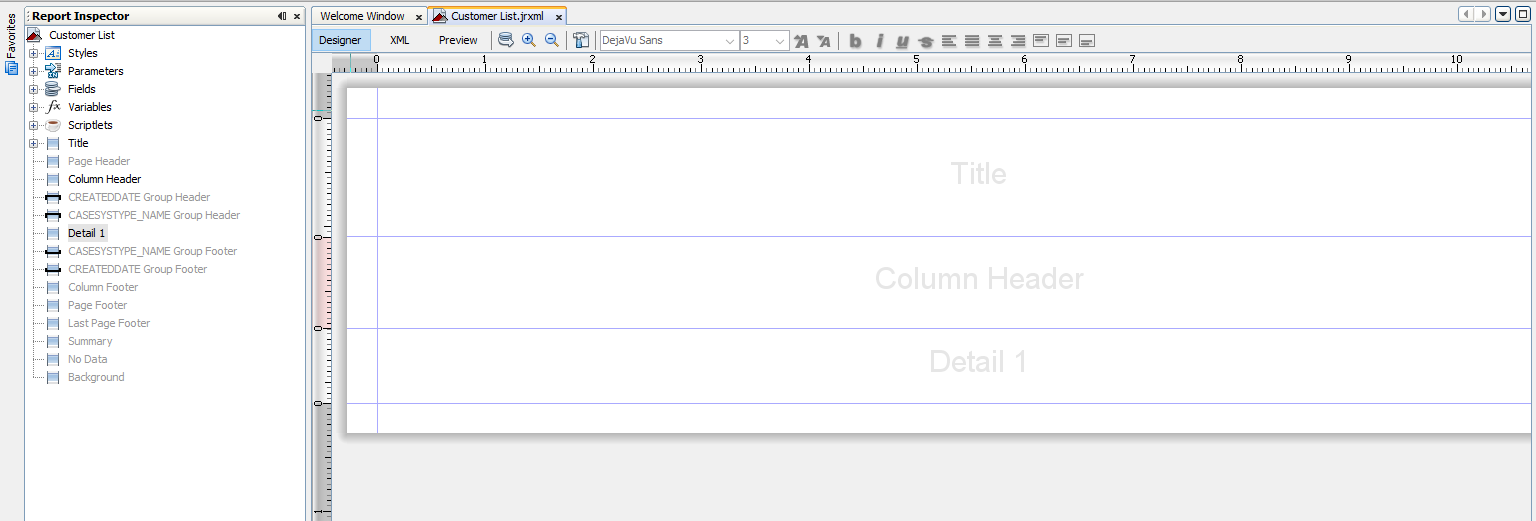
As this is a simple report, we’ll stick to having the three basic sections:
Title – section for putting the report title
Column Header – section for displaying the header of each column
Detail 1 – section for showing the data rows
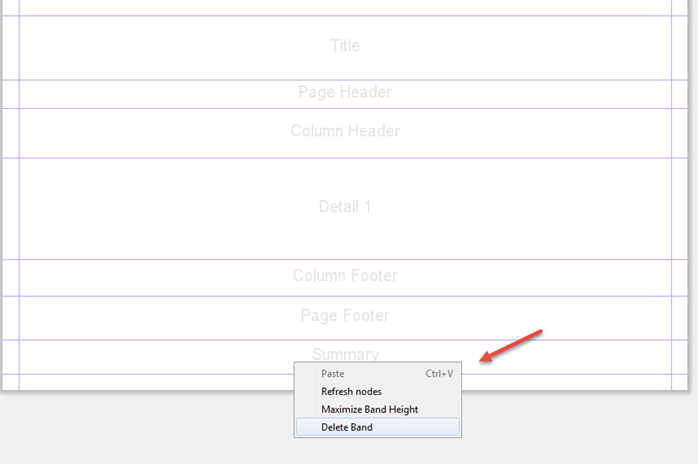
Remove the sections we won’t use by simply right click on the section and selecting Delete Band. In the example below, we removed the Summary section.
Repeat until you have removed all sections except for Title, Column Header, and Detail 1.
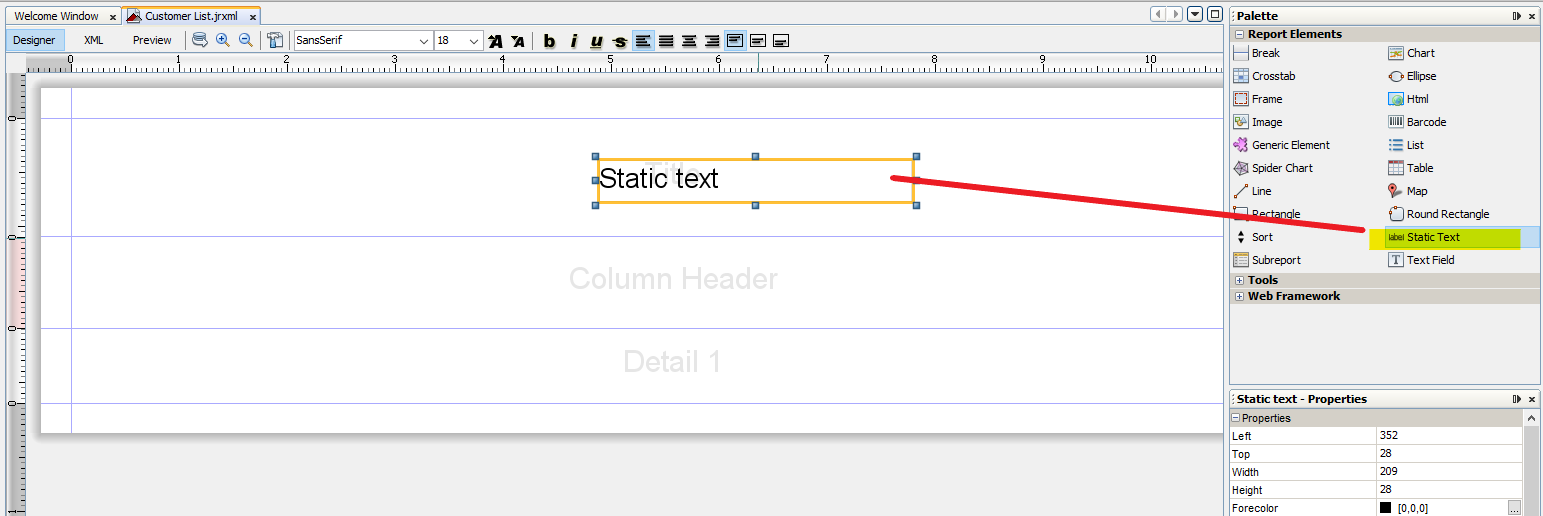
Add the Title to the report by dragging a Static Text control from the Palet at the right into the Title section.
If you don't see the Pallet, activate it under Window → Palette, or click CTRL-SHIFT-8.
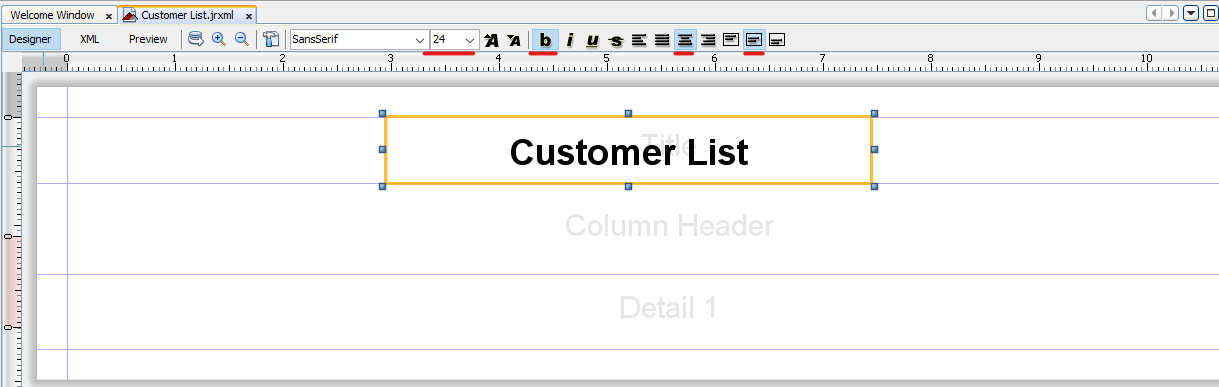
Double click on the Static Text field you just created and type in Customer List. Set the font size to 24, select bold, and set the horizontal and vertical positions to Centered.
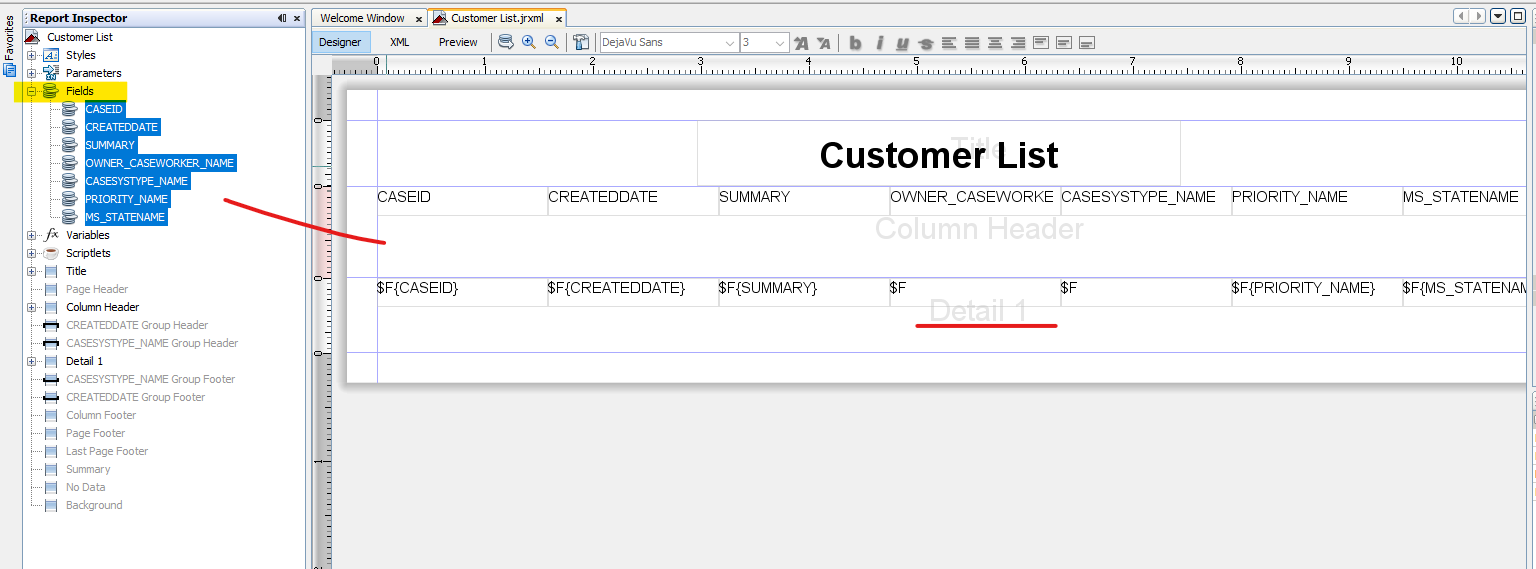
To add the fields to the report you can either drag each column one by one or do a bulk add of all columns. From the Report Inspector window, expand the Fields node, select all the fields and dragged them to the Detail 1 section (band). See that all the fields will evenly space themselves horizontally on the page and align with their headers which were automatically created in the Column Header section.
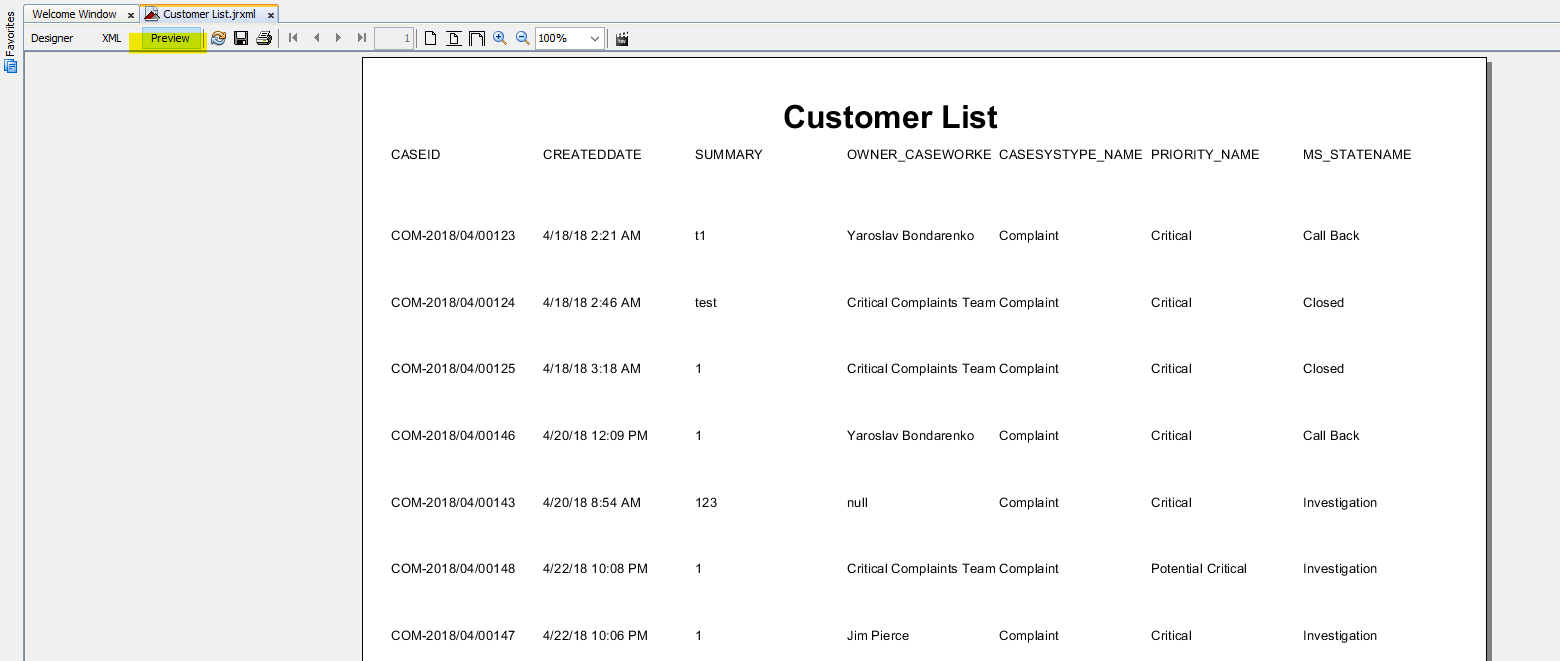
Test the report by clicking the Preview tab to see if your report returns some records.
Return to the Designer surface by clicking the Designer tab at the top of the window.
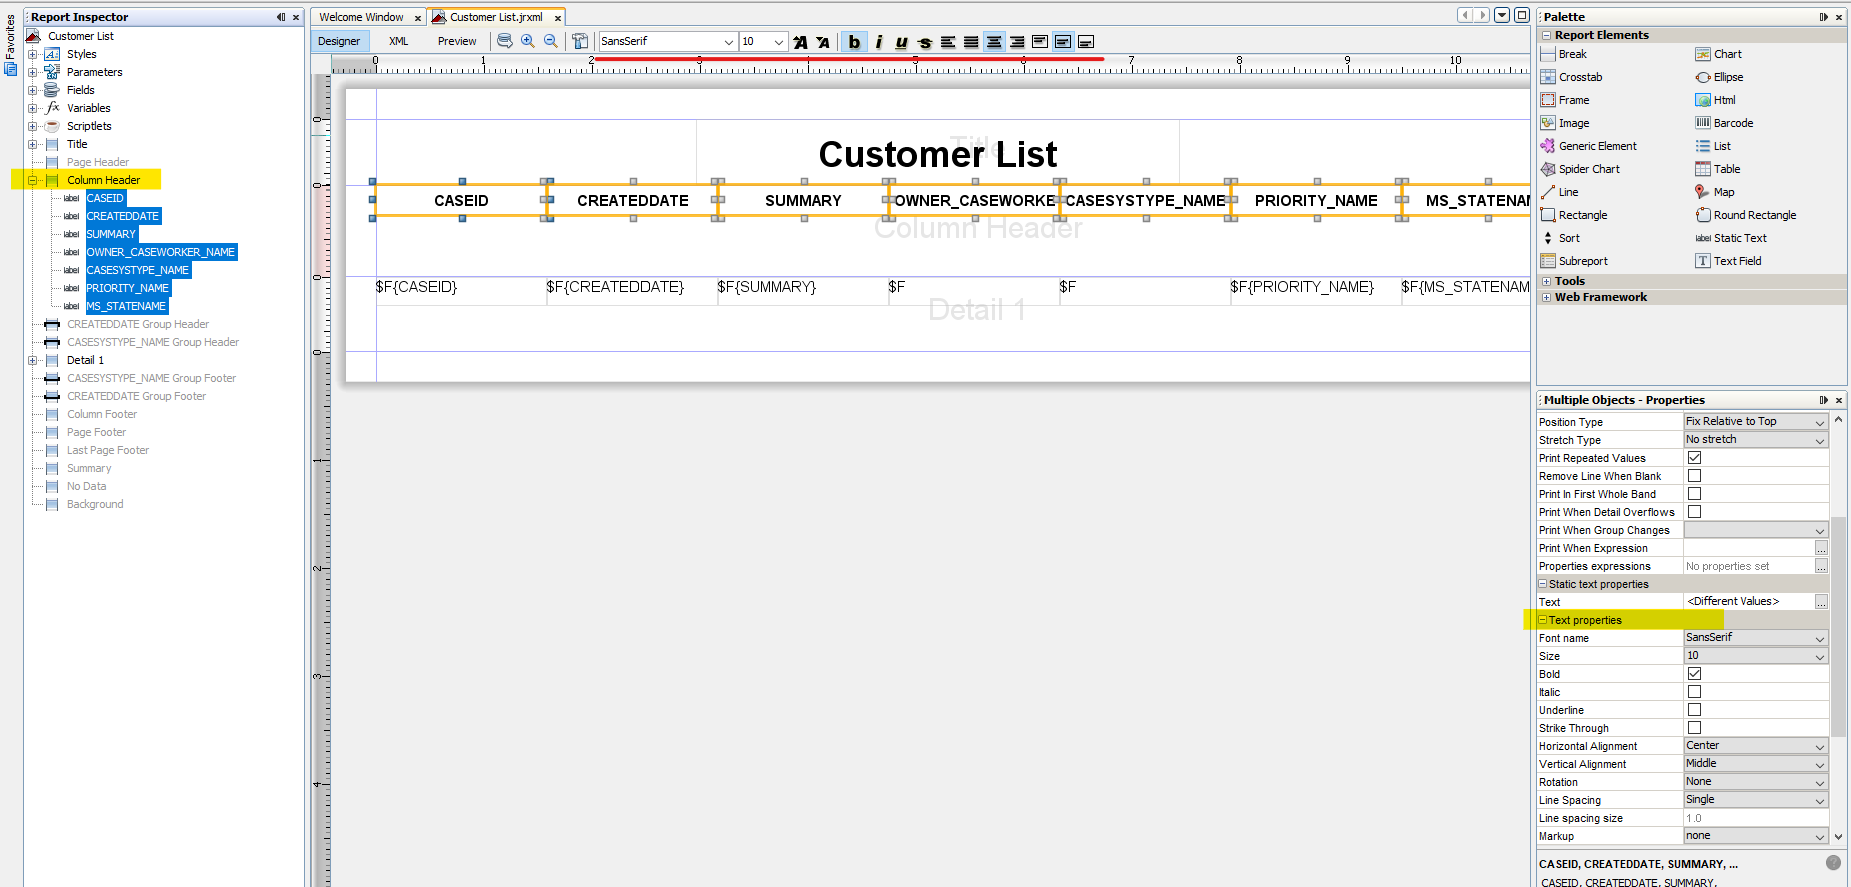
In the Column Header band, select all the Static Text labels. All fields in this selection area will appear highlighted.
Make these labels Bold, Center, and Middle. You can use the control at the top bar or the Text properties at the right.
Select the Column Header band and set the Band height to 20 px in the Band properties at the right panel.
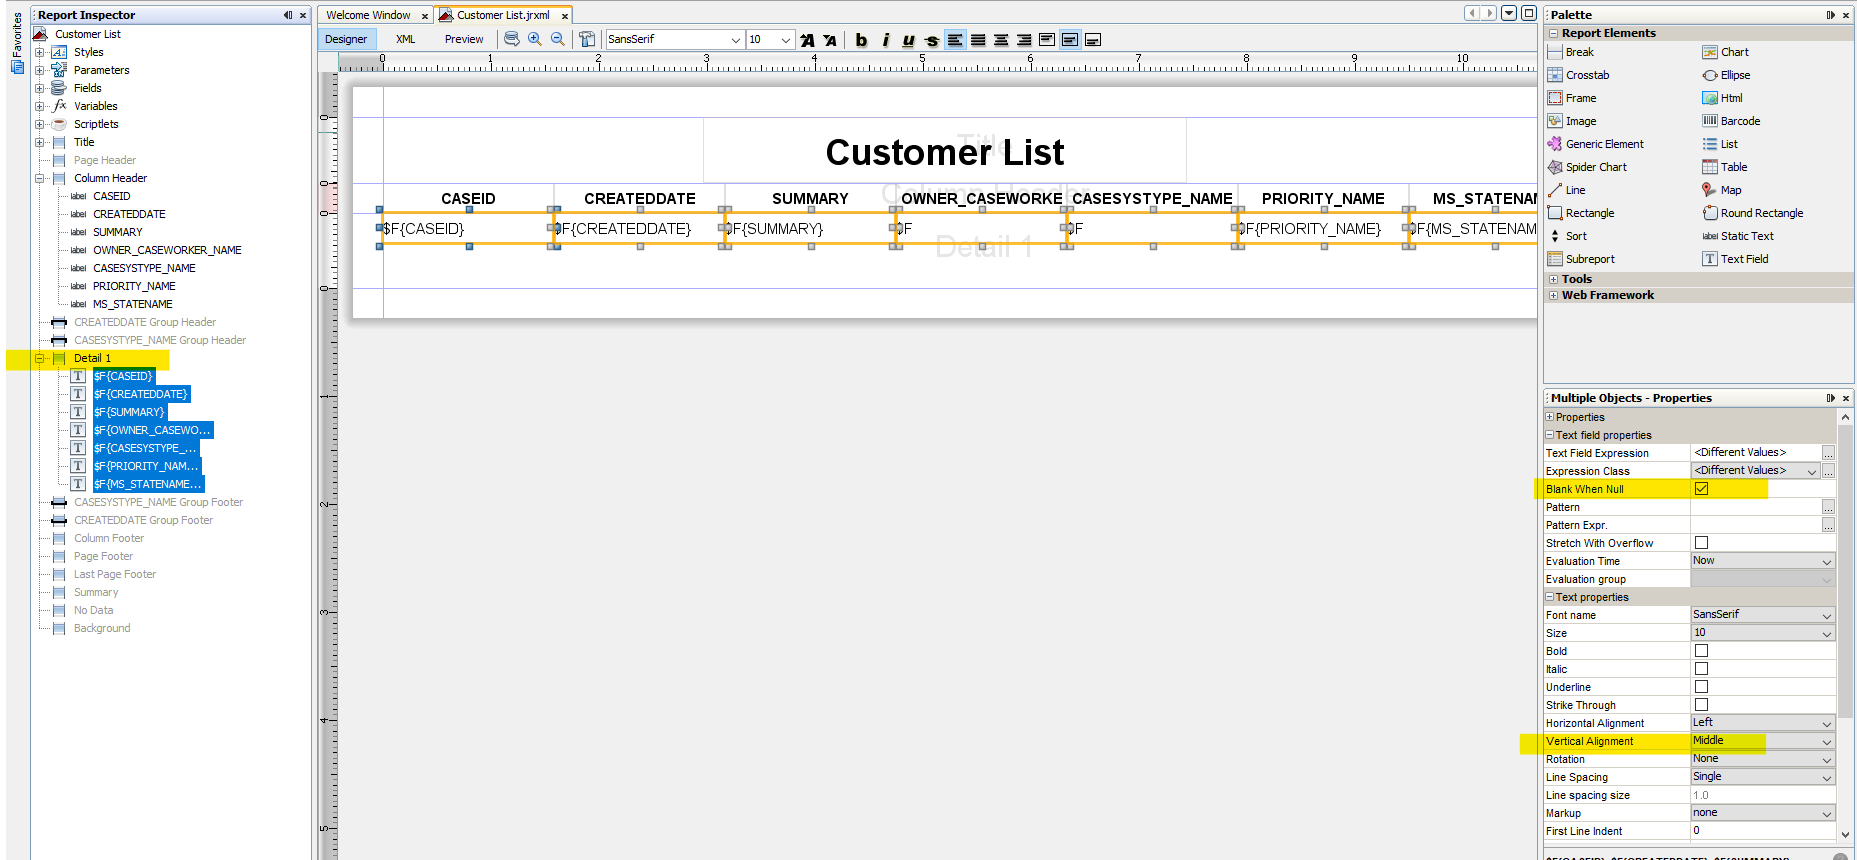
In the Detail 1 band, select all the fields. All fields in this selection area will appear highlighted.
Set the Vertical Alignment to Middle. You can use the control at the top bar or the properties at the right.
In the right panel select the properties window, look for the Blank When Null property and check it.
Select the Detail 1 band and set the Band height to 20 px in the Band properties at the right panel. .
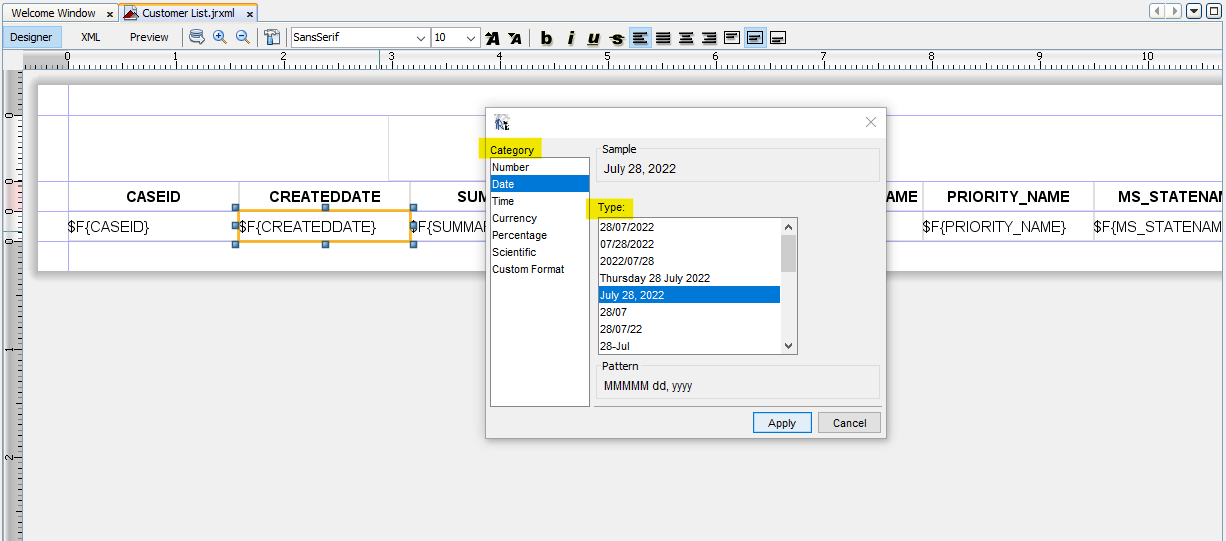
Select the CREATEDDATE date field. By default, this will return the time component of this field so we'll apply a pattern to this field to only return the date component. Right-click over the field and select the Field pattern property. Select Date under Category and select the MMMM dd, yyyy pattern for Type.
Click the Apply button.
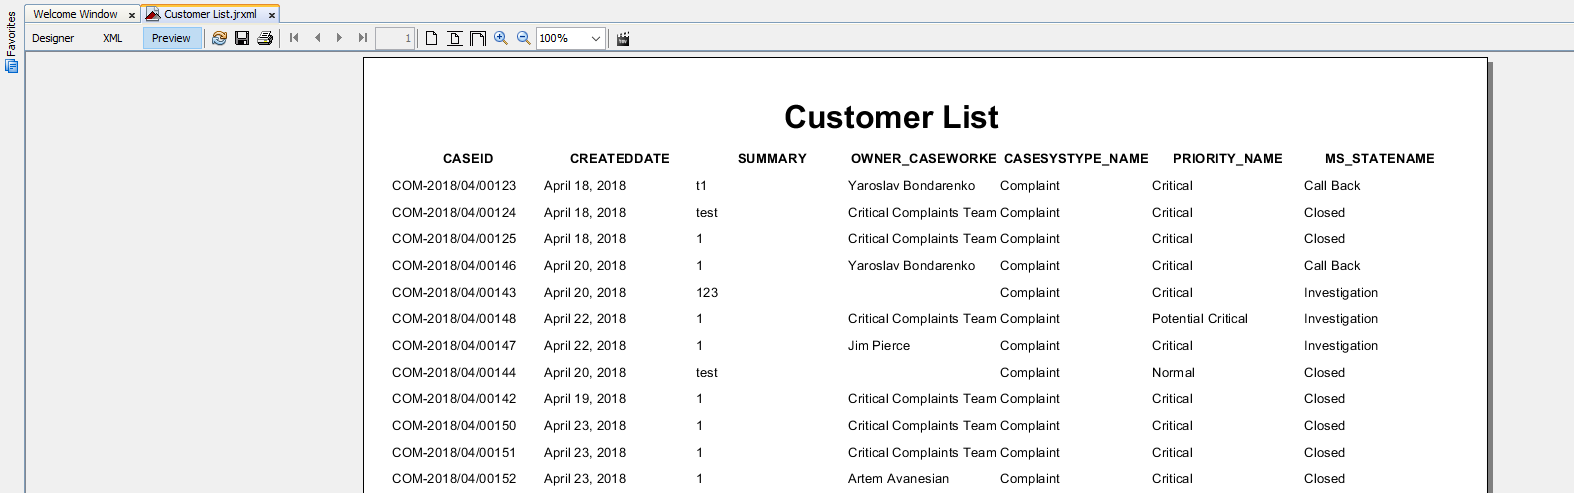
Preview your report. When properly spaced, the report should look like follows: