
Building a New iReport
The following tutorial provides some guidance on building a basic report in iReport that can then be imported into AppBase so it can be generated by authorized users. This means that a report can either be generated directly from iReport or through the report launcher screen in AppBase.
For this example, we are going to use a SQL statement to base the report on. This is considered building the report manually using one of the iReport templates (i.e. Blank A4 or Blank A4 Letter) to format it. The SQL statement we are going to use returns all records in a sample Customer table.
You can find examples of reports under the Basic Reports folder if you use the ready-to-go installer or download this Case Inventory_Example.jrxml from here.
Steps
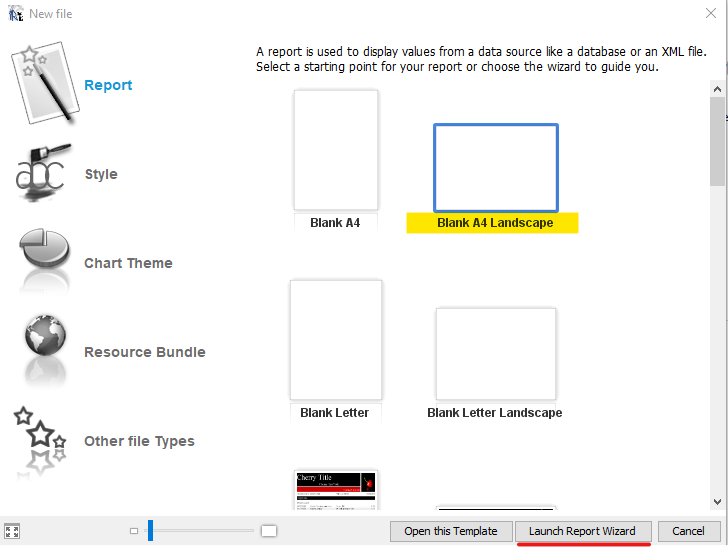
- Launch iReport and once it opens, navigate to the menu File → New...
- Select the Blank A4 Landscape template then click on the Launch Report Wizard at the bottom.
Set the Report name to Customer List and set the Location to a local folder to save the report source which will be stored as a
.jrxmlformat (Example:Customer List.jrxml).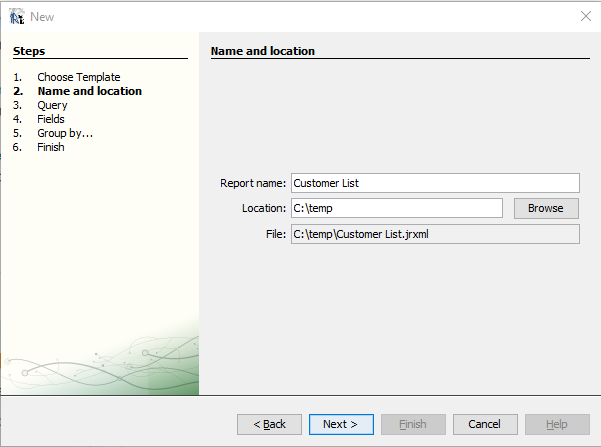
After you have written the report, you will need to upload the
.jrxmlfile to AppBase so it is important to save the report source in a directory you can easily access- Select the Connections/ Data Sources to use for this report (The connection created in the previous chapter).
Insert the following SQL statement in the Query (SQL) window.
SQLSELECT cv.id as ID, cv.CASEID as "Case Number", cv.CASESYSTYPE_NAME as "Case Type", cv.CREATEDDATE as "Created Date", cv.PRIORITY_NAME as "Priority", cv.SUMMARY as "Summary", cv.OWNER_CASEWORKER_NAME as "Case Owner", cv.CASESTATE_NAME as "Current State", cv.RESOLUTIONCODE_NAME as "Resolution" FROM VW_DCM_SIMPLECASELIST cv WHERE cv.CASESTATE_ISFINISH <> 1 AND TRUNC(VSCL.CREATEDDATE) BETWEEN TRUNC(SYSDATE - 7) AND TRUNC(SYSDATE)The columns in the select SQL query will be the data available to add to the report.
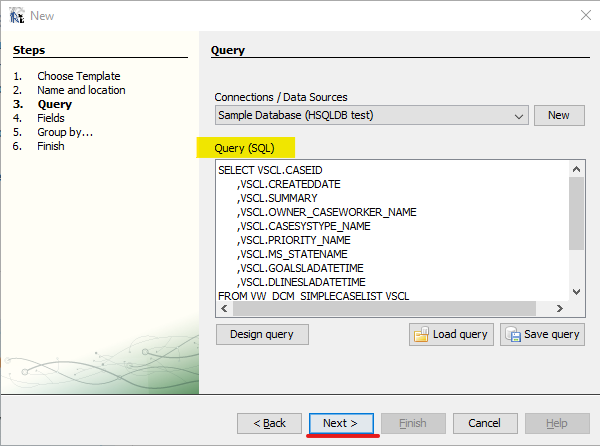
- Click the Next button when done. The system will take a few seconds to validate your query and if any issues, it will advise you of a problem. If your query fails, the first thing to check is that you have selected the correct Connection and have access to the database.
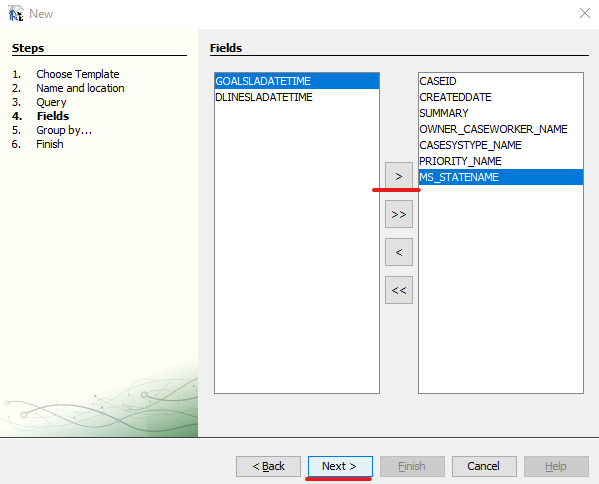
- The next window will show you the columns available for use in the report (based on the columns you return in your query). You can move the columns you want to use in the report to the right side or leave them on the left if not to be used. Click the arrow button pointing to the right to move the columns to the right then click the Next button.
- The following Group by... window can be used to create sections in the report where data is to be grouped to help summarise information. For instance, you may have a report that returns a quantity value column (i.e. amount spent, number of widgets ordered, etc) for each customer and you wish to have the report show all the records grouped by customer name with a summary of all the quantity values for that customer.
- Select the CREATEDDATE field for Group 1 and the CASESYSTYPE_NAME field for Group 2.
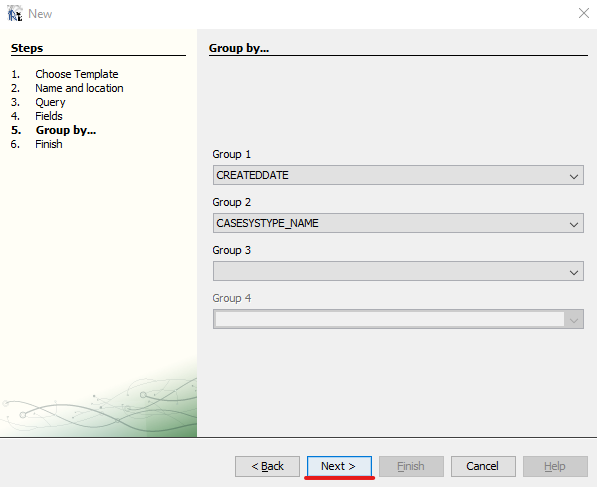
- Click the Next button.
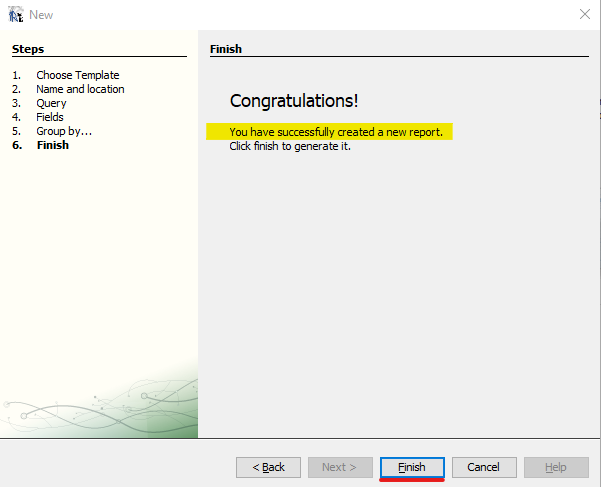
- If everything is OK, you will see a Congratulations message. Click the Finish button to close the wizard.
You will now be taken to the report design area to start formatting your report. Go to the next article Report Layout and Formatting to continue building the report.