The dashboard typically includes widgets, such as charts, tables, and graphs, clearly and concisely displaying data. Users can drill down into the details of each widget to get a more comprehensive view of the underlying data. The dashboard may also include alerts and notifications that inform users of critical events or changes in the data.
Steps
Go to → <<your solution>>
Navigate to → Setup
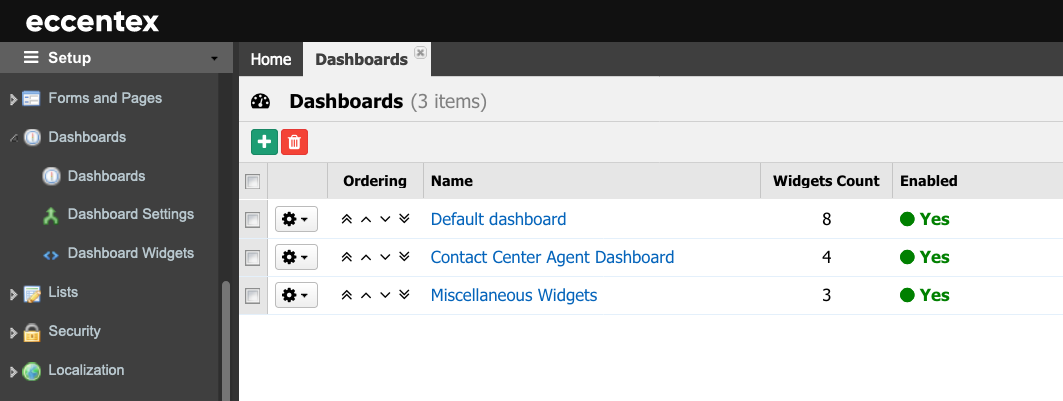
Navigate to Dashboards. Here, you can see three dashboard menus: Dashboards, DashboardSettings, and DashboardWidgets.
SelectDashboards. You will find theDefaultdashboard. We will keep this default dashboard and create a new one from here.
Click the plus sign icon to create a new customized dashboard.
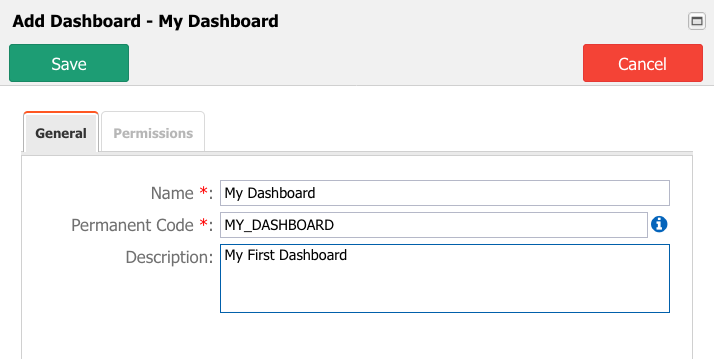
Enter a Name for the dashboard. The Permanent Code field will be auto-populated based on the name you entered (but you can override this if you like, ensuring that there are no special characters or whitespaces used)
Add a brief Description.
Saveyour new dashboard.
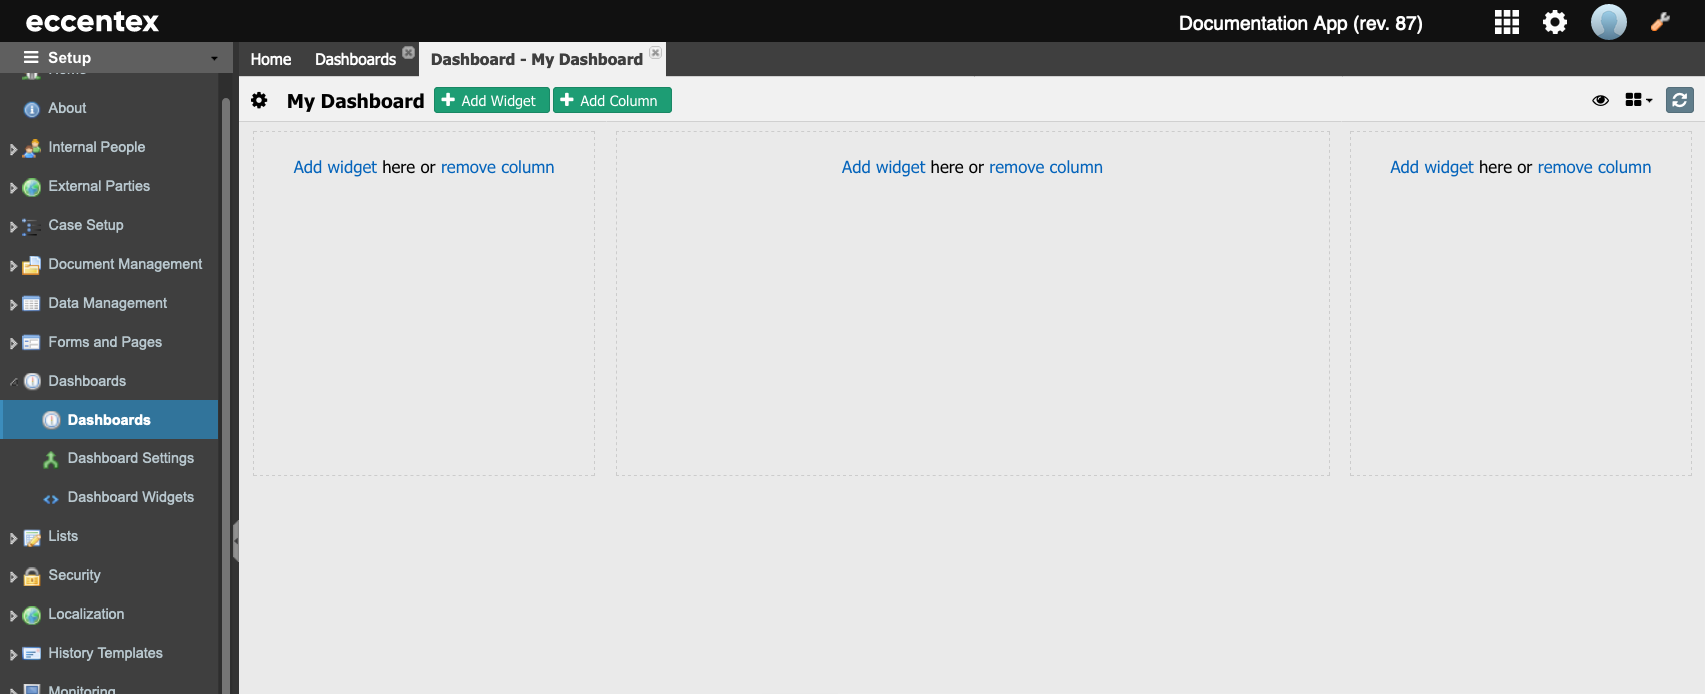
Click on the hyperlink of your new dashboard to open it. You will find an empty area with a predefined layout of three columns. You can add predefined widgets to each one of these columns.
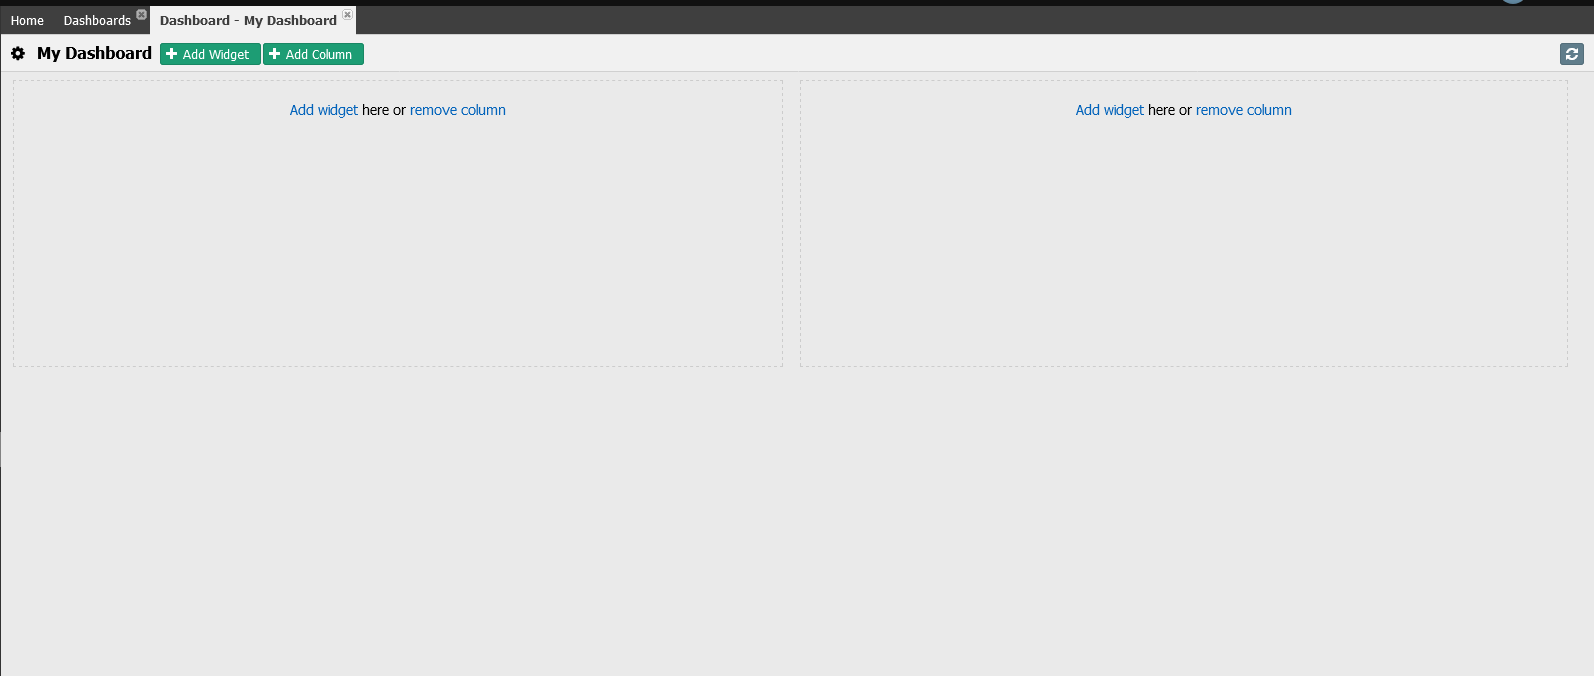
Remove one column and re-size the other two to have the same width.
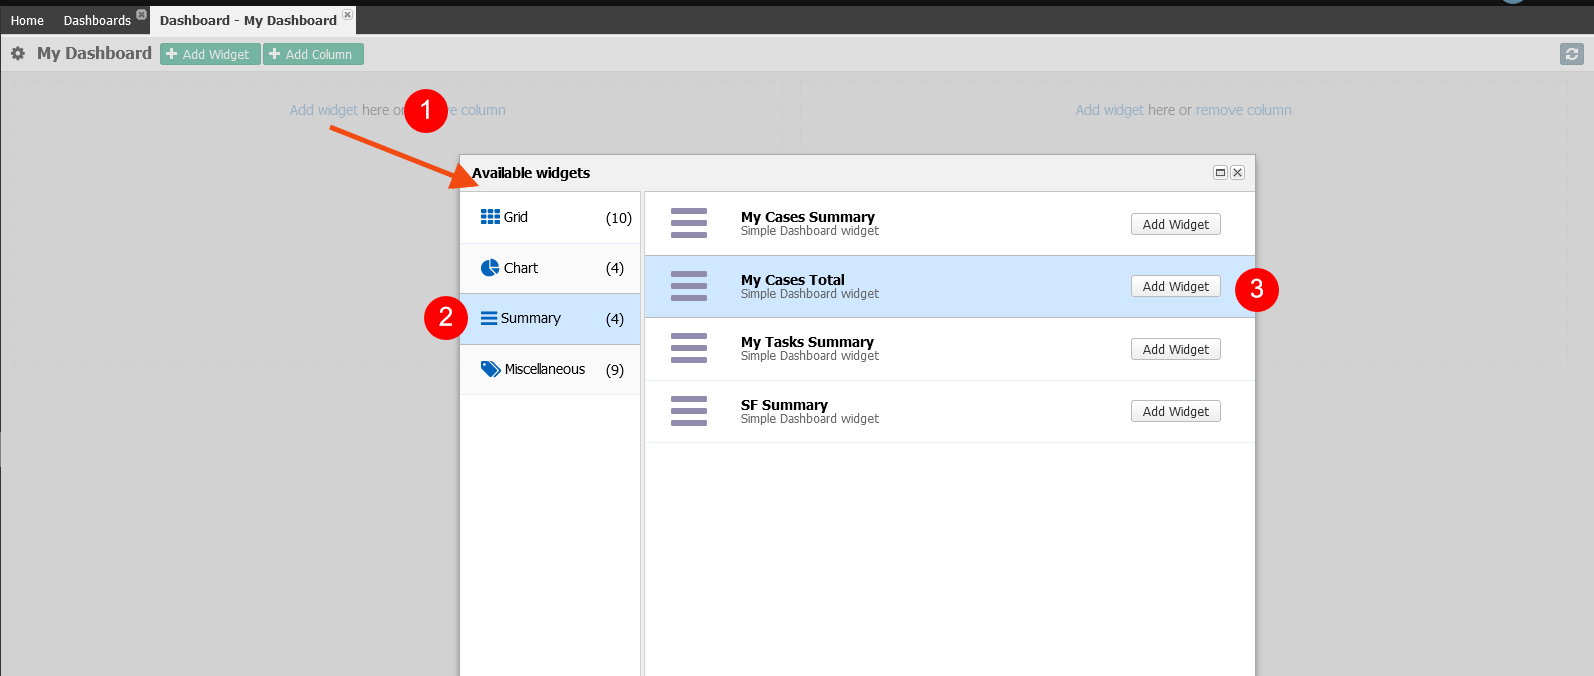
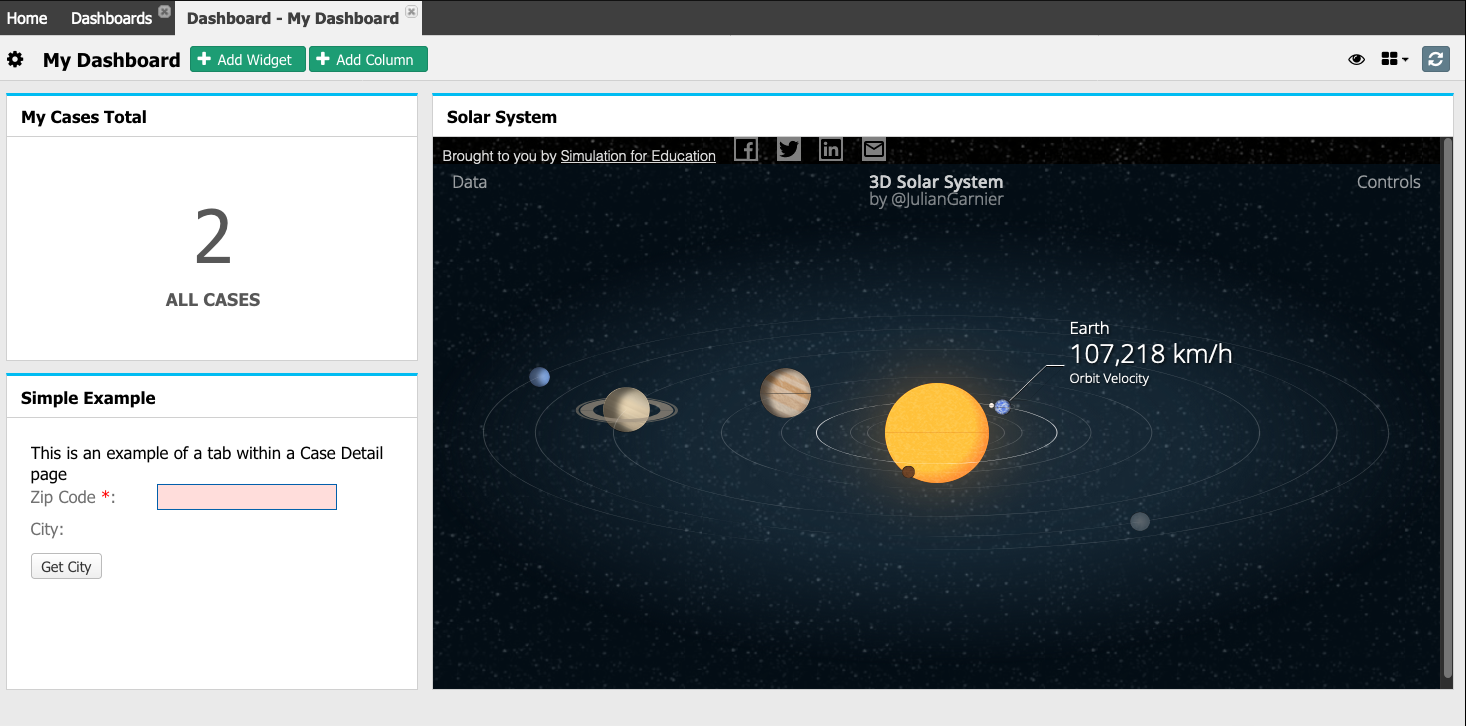
Click onAdd Widget(1) link on the left column. On theAvailable widget'swindow, selectSummary(2) and thenMy Cases Totalwidget, then click onAdd Widgetbutton (3).
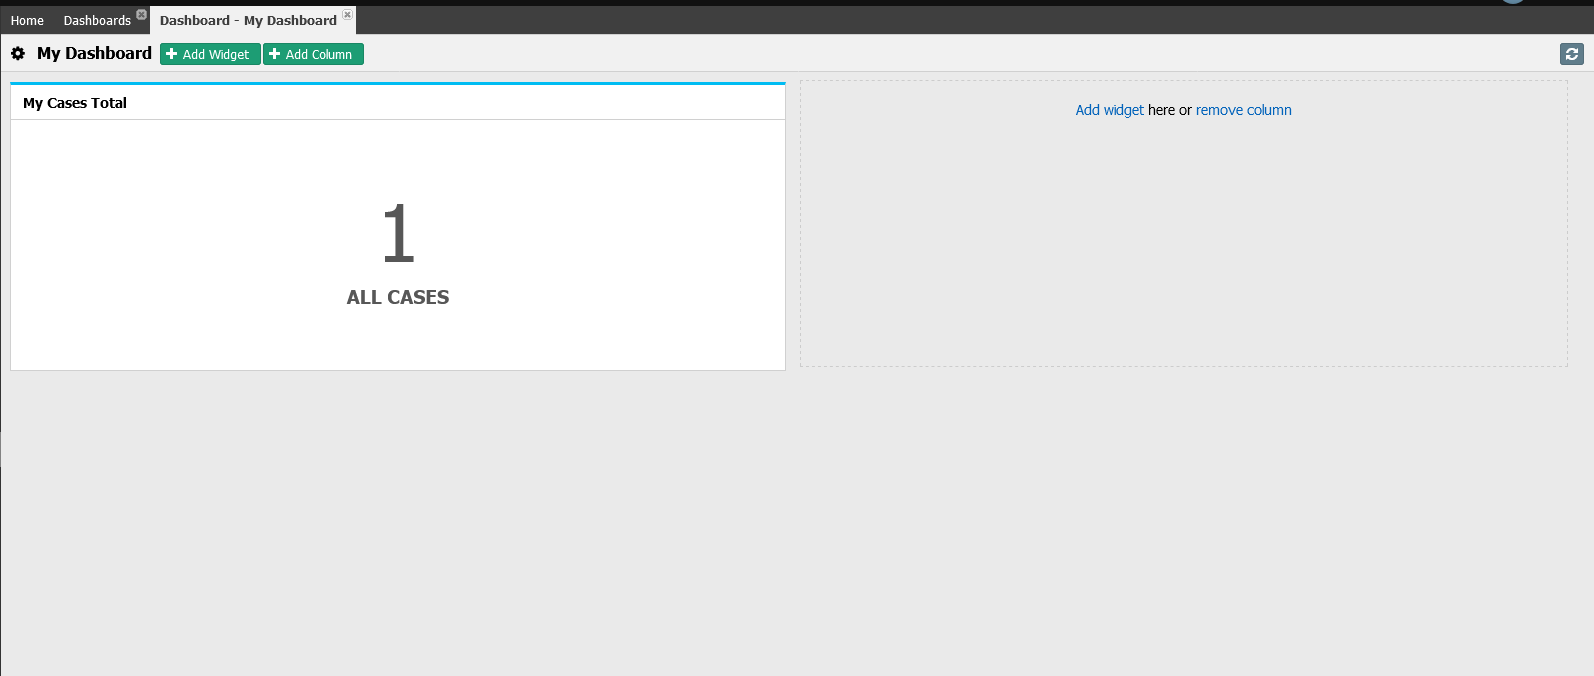
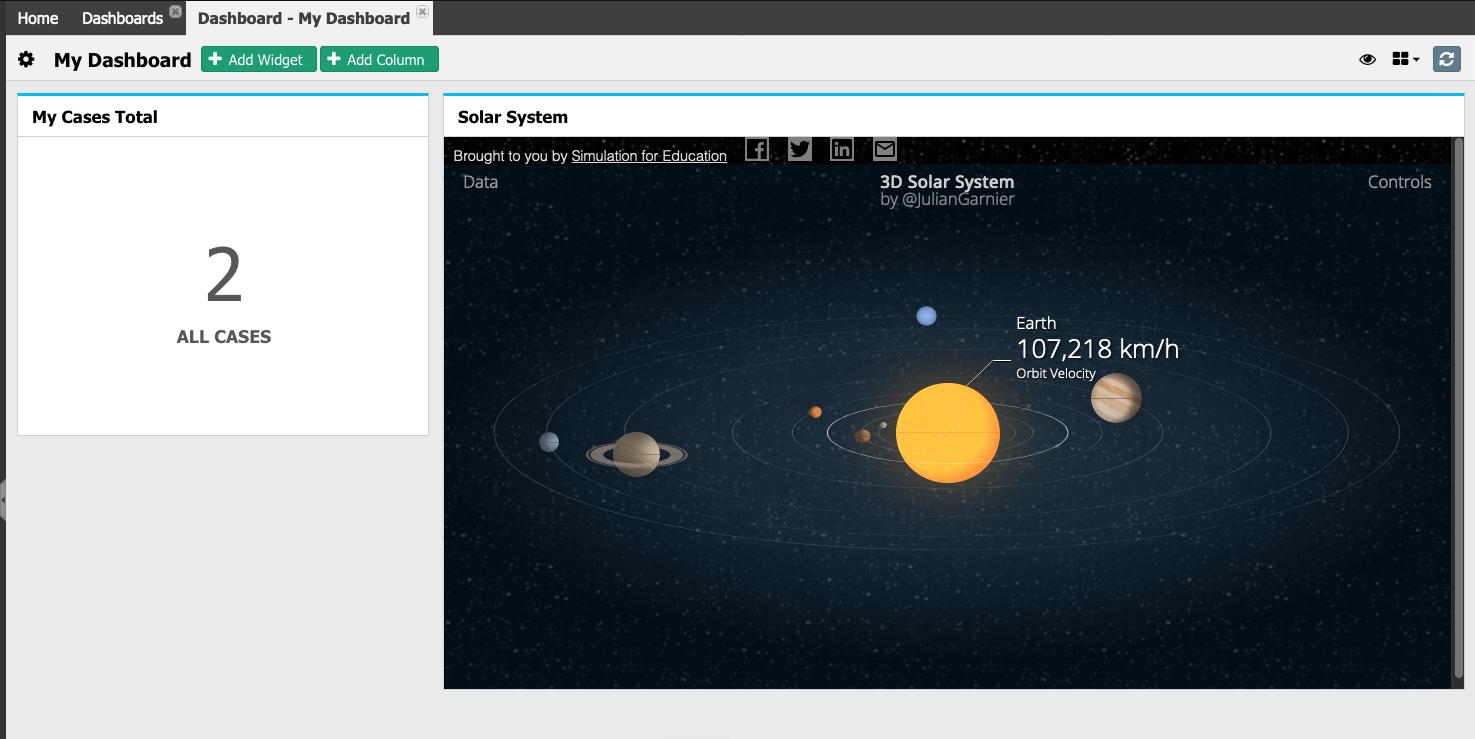
Check your dashboard with the following image. This newly added widget will show thetotal numberof cases of your solution.
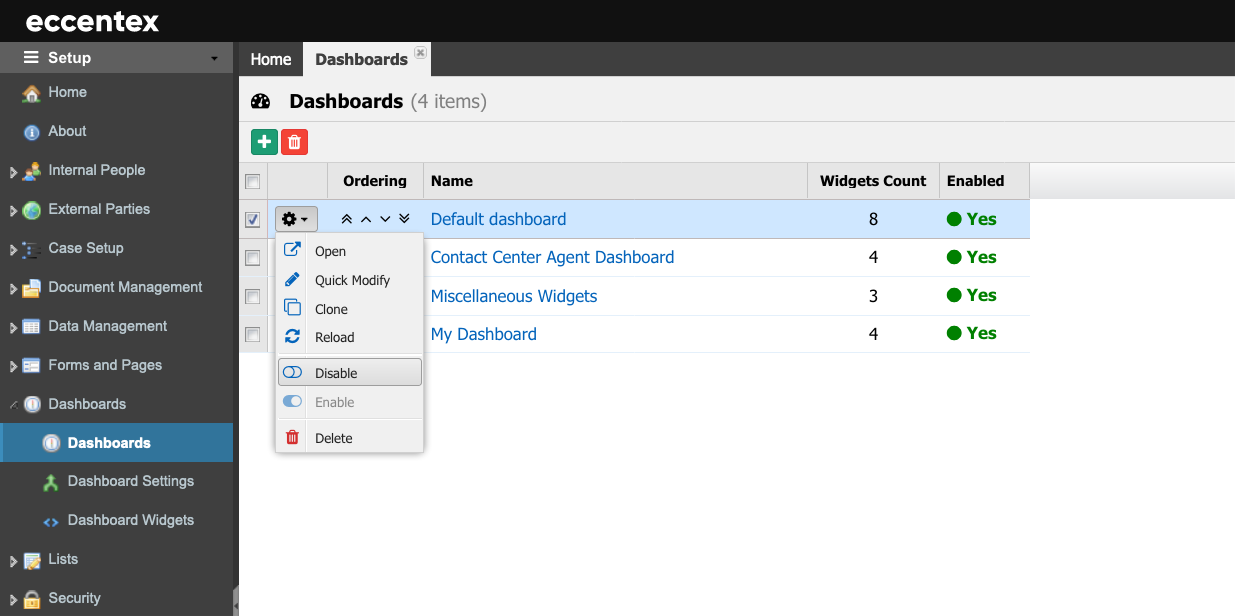
To set our new dashboard as default, we need todisablethe Default dashboard.
Click the gear to open the Control menu and click theDisableoption. Deactivated Dashboards will appear with a red shade and a strike-through effect to indicate that they are no longer in force.
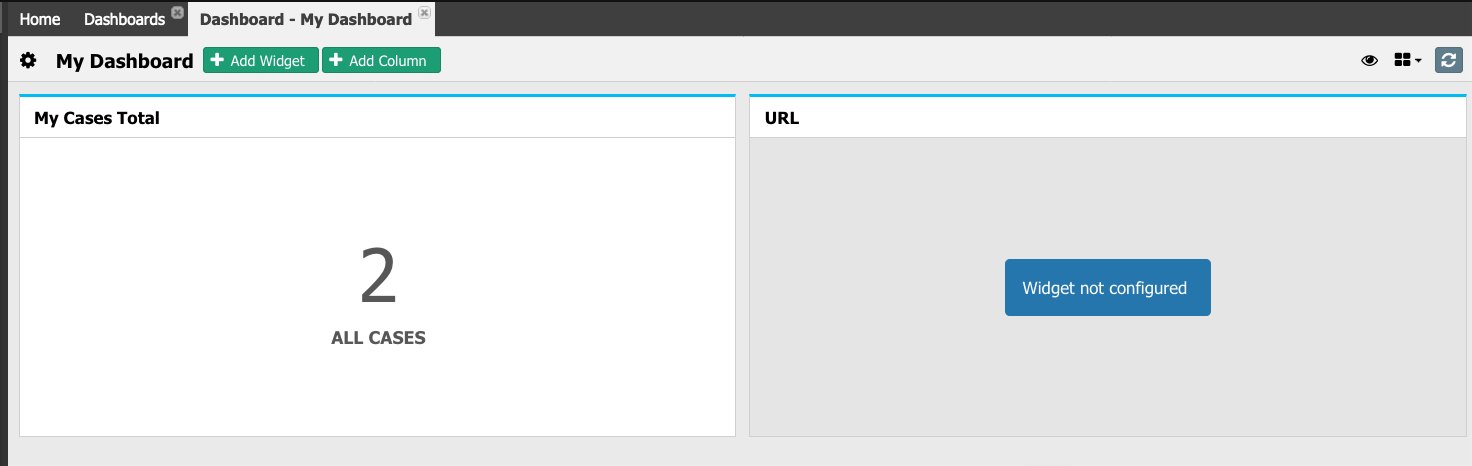
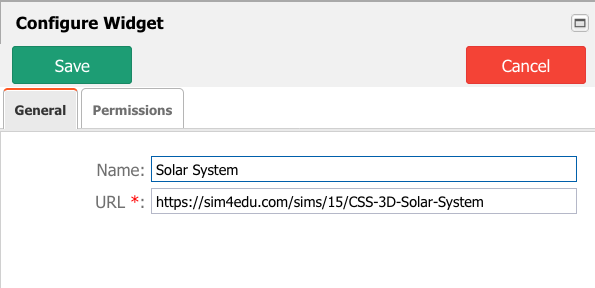
Click onAdd Widget.On theAvailable widget'swindow, selectMiscellaneousat left and theURL widget from the right section, then click on theAdd Widgetbutton.