The Queue Monitor processor page reviews information about your system's queue processor activity. Monitoring the queue processing helps identify performance issues in a timely way and keeps your system running smoothly. You can trace the state of the queue processors.
Each rule executed by the DCM - in this instance, mostly any custom rules - is passed to an underlying AppBase service that is then queued to be executed. The Queue Monitor shows all the rules executed by the DCM, whether the rule was executed successfully, and the date it ran.
Steps
On the top right, navigate to → <<your solution>>
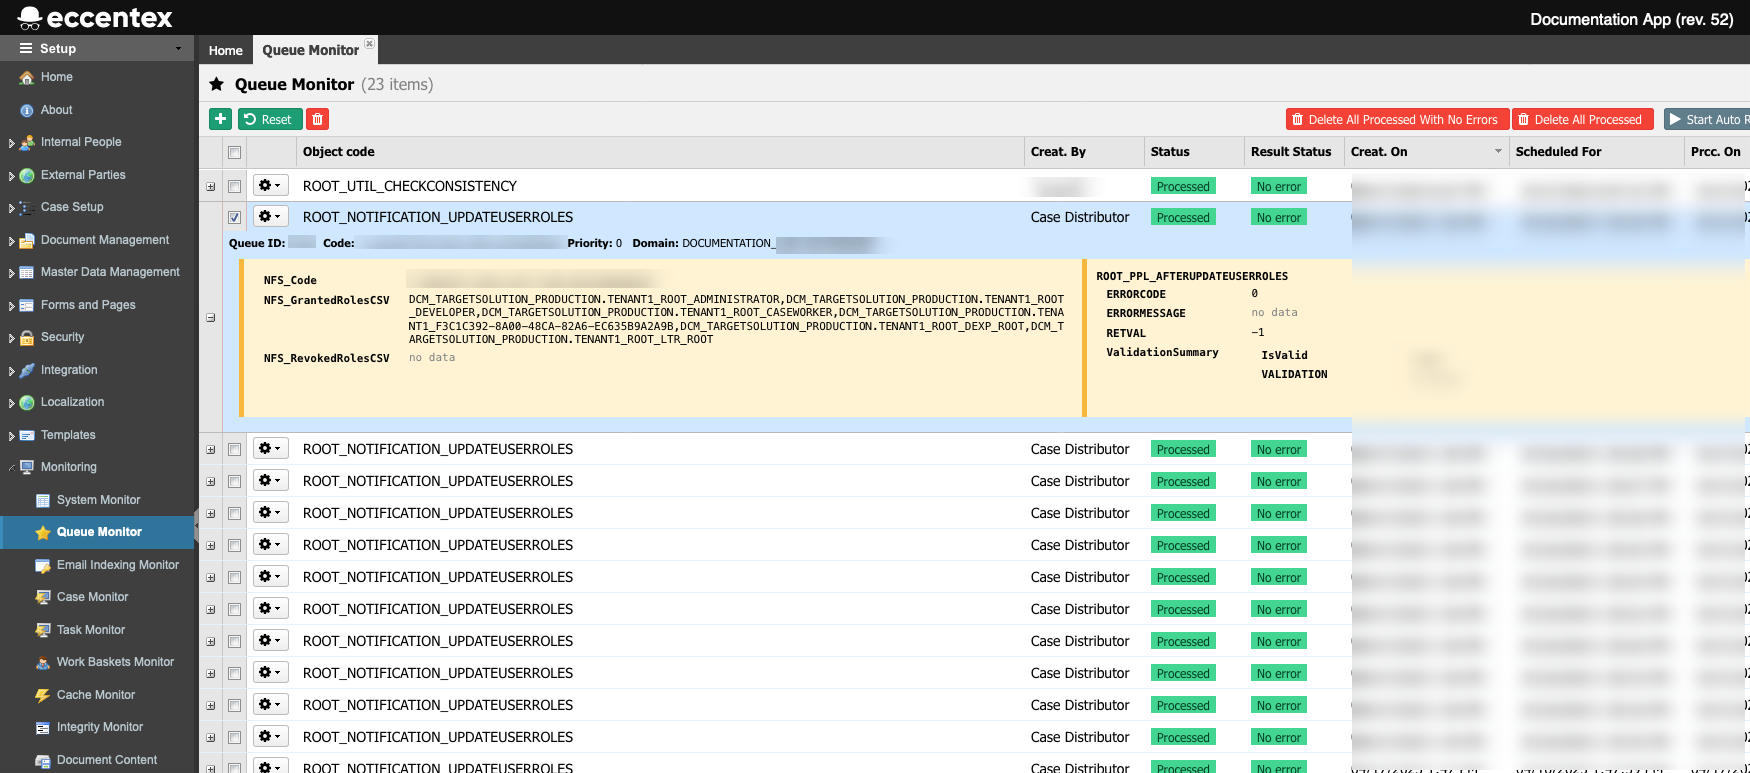
On the left, navigate to → Setup
Navigate toMonitoring → Queue Monitor. The new tab will display a list of processes in the queue.
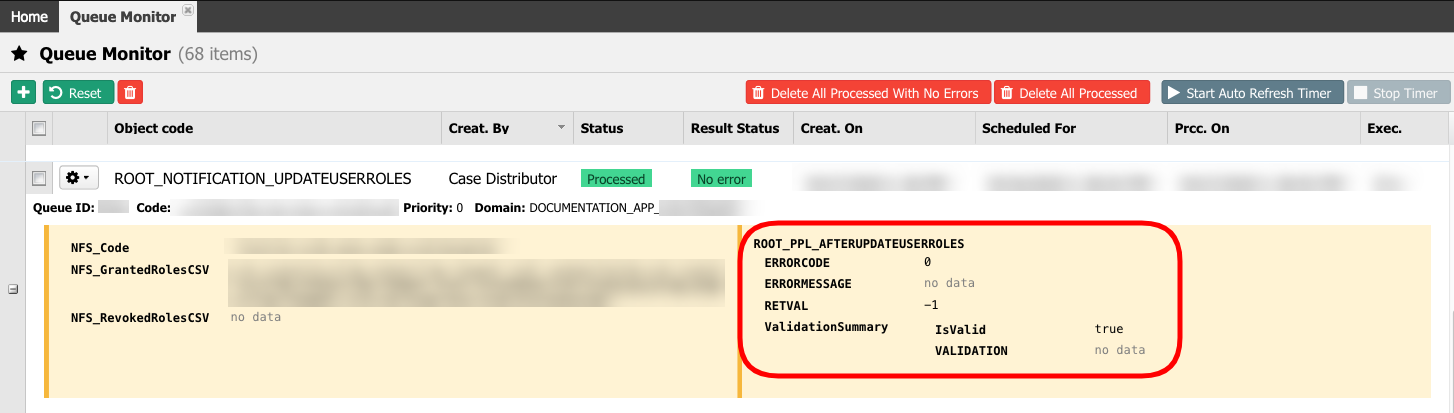
Here, you can see the process's Status and Result Status in the queue. The possible valid Status is: Pending, Processing, Executing, or Processed. The Result Status can be Error or No Error.
To see more details on a particular process, you can click on the plus icon at the left border of the event name to reveal more details. On the left panel, you can find the ERRORCODE and the ERRORMESSAGE and any other additional information that the process was coded to display.
Search
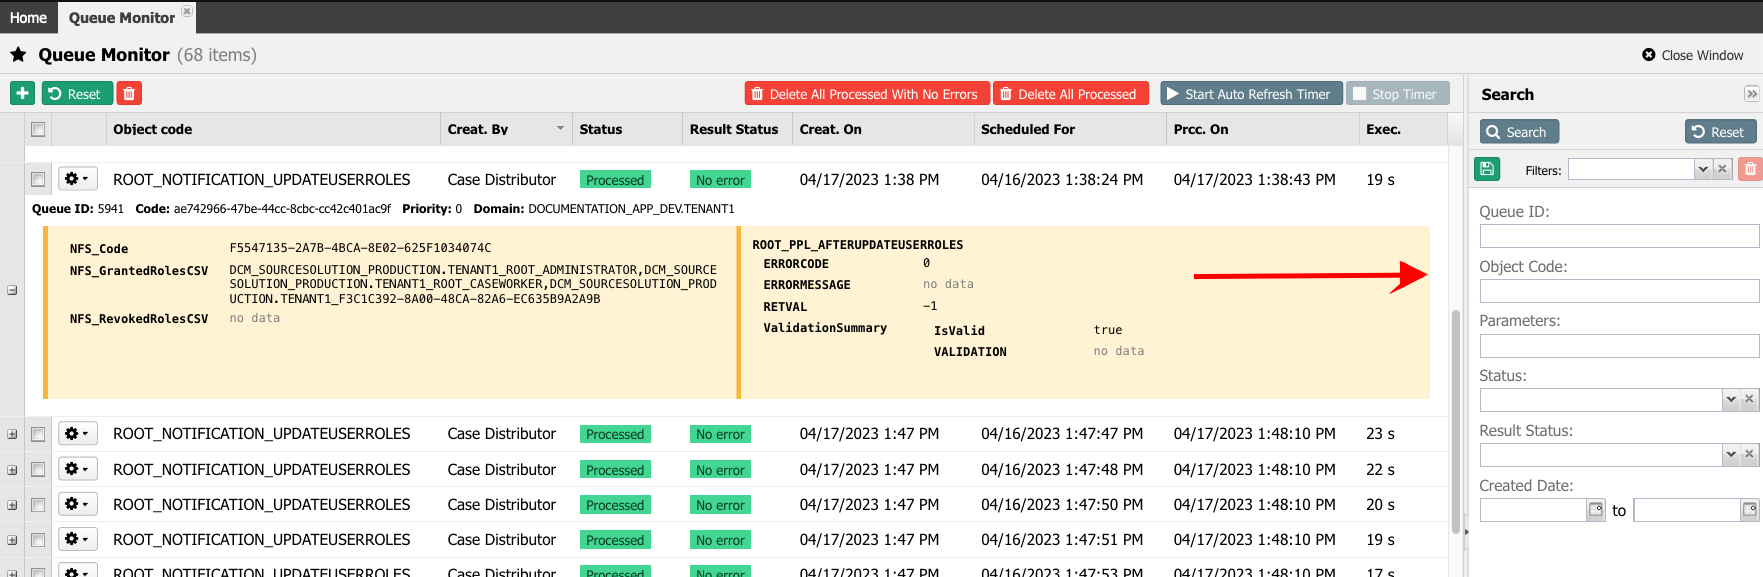
You can use the search panel at the top right of the screen to locate one or more records to view.
Use the fields in the Search panel to refine the list of records shown in the grid. For example, enter the rule's name in the Object Code field or select a date range using the Created Date range fields.
Click the Search button to run the search.
You can save your search settings using the floppy disk button for further usage.
To reset the search fields (and refresh the list back to its original state), click on the Reset button.


 at the left border of the event name to reveal more details. On the left panel, you can find the ERRORCODE and the ERRORMESSAGE and any other additional information that the process was coded to display.